Leopold

Climate Recreation Community Catastrophe

Leopold
Eden Index

Climate 8.1 Recreation 3.1 Community 2.0 Safeguard

4.8/10

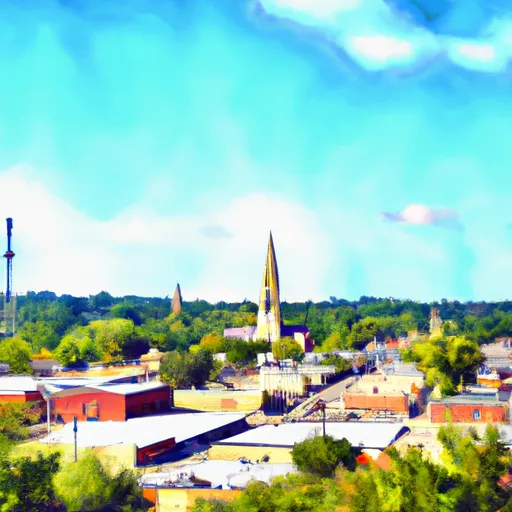
Leopold, Missouri is a small unincorporated community located in southeastern Bollinger County. The region experiences a humid subtropical climate, characterized by hot and humid summers and mild winters. Average high temperatures in Leopold range from the upper 80s to low 90s Fahrenheit during summer months, whereas winter temperatures typically hover around the mid-40s.

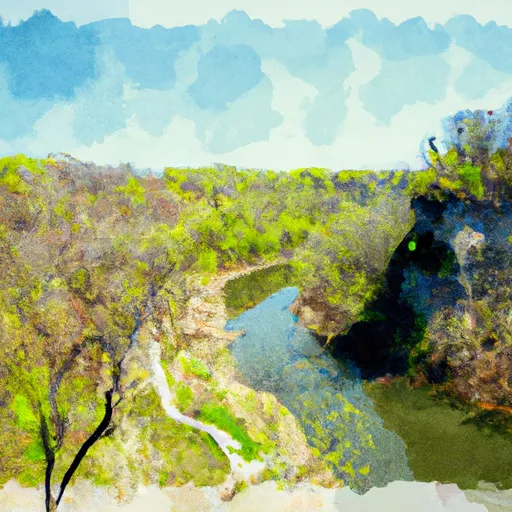
Leopold is surrounded by various hydrological features, including small creeks and rivers that contribute to the local hydrology. These water bodies provide habitat for a diverse range of aquatic species and offer opportunities for fishing and boating enthusiasts.

Outdoor recreation opportunities in Leopold are abundant. The region boasts numerous public lands, including state parks and conservation areas, which provide opportunities for hiking, camping, and wildlife observation. Additionally, the nearby St. Francis River offers excellent opportunities for canoeing, kayaking, and tubing.

In conclusion, Leopold, Missouri experiences a humid subtropical climate with hot summers and mild winters. The area's hydrology is characterized by small creeks and rivers, offering opportunities for fishing and boating. Outdoor enthusiasts can indulge in various activities, including hiking, camping, wildlife observation, and water sports on the nearby St. Francis River.

What is the Eden Index?

The Snoflo Eden Index serves as a comprehensive rating system for regions, evaluating their desirability through a holistic assessment of climate health, outdoor recreation opportunities, and natural disaster risk, acknowledging the profound impact of these factors on livability and well-being.


Climate Health Indicator (CHI): 8.1


Leopold receives approximately 1218mm of rain per year, with humidity levels near 85% and air temperatures averaging around 14°C. Leopold has a plant hardyness factor of 6, meaning plants and agriculture in this region thrive during a short period during spring and early summer. Most plants will die off during the colder winter months. By considering the ideal temperature range, reliable water supplies, clean air, and stable seasonal rain or snowpacks, the Climate Health Indicator (CHI) underscores the significance of a healthy climate as the foundation for quality living.

A healthy climate is paramount for ensuring a high quality of life and livability in a region, fostering both physical well-being and environmental harmony. This can be characterized by ideal temperatures, reliable access to water supplies, clean air, and consistent seasonal rain or snowpacks.


Weather Forecast


Streamflow Conditions

Upper Mississippi-Meramec

Area Rivers

Upper Mississippi-Meramec


Snowpack Depths

Upper Mississippi-Meramec


Reservoir Storage Capacity

Upper Mississippi-Meramec


Groundwater Levels


Recreational Opportunity Index (ROI): 3.1


The Recreational Opportunity Index (ROI) recognizes the value of outdoor recreational options, such as parks, hiking trails, camping sites, and fishing spots, while acknowledging that climate plays a pivotal role in ensuring the comfort and consistency of these experiences. Access to outdoor recreational opportunities, encompassing activities such as parks, hiking, camping, and fishing, is crucial for overall well-being, and the climate plays a pivotal role in enabling and enhancing these experiences, ensuring that individuals can engage in nature-based activities comfortably and consistently.


Camping Areas

Campground Campsites Reservations Toilets Showers Elevation
Jim Edgar Panther Creek WA 75 609 ft
Old Fort - Grenada Lake 21 279 ft
DLo Water Park None 312 ft
Spring Lake State Conservation Area 70 507 ft
Simpson County Lake 11 427 ft
Rocky Arbor State Park 90 852 ft
Lake Columbia 12 212 ft
Camp New Wood County Park None 1,322 ft
Rice Lake State Conservation Area 35 452 ft
Goshen Springs None 304 ft
Bryant - Grenada Lake 6 210 ft
Waverly Lake City Park None 663 ft
Sand Ridge State Forest - Forest City 27 498 ft
Francis City Park None 816 ft
Atwood Water Park None 218 ft
Council Grounds State Park 55 1,300 ft
Lincolns New Salem Historic Site 200 606 ft
Mirror Lake State Park 165 868 ft
Okatoma Water Park None 396 ft
Fontainebleau State Park None 18 ft
North Abutment - Grenada Lake 88 251 ft
New Orleans Reserve Military None 0 ft
Lake Girardeau Conservation Area - MDC None 404 ft
Skuna/Turkey Creek - Grenada Lake None 246 ft
Sara Park None 1,443 ft
Johnson Sauk Trail State Park 95 747 ft
Hennepin Canal Parkway State Park None 667 ft
White Mound County Campground None 1,116 ft
Holmes County State Park None 367 ft
Horseshoe Lake Recreation Area 50 424 ft
Tower Hill State Park 15 745 ft
Randolph County State Conservation Area 95 513 ft
Fulton County Rec Area 40 604 ft
Low Head Dam None 310 ft
Jubilee College State Park 165 674 ft
Scott AFB Military None 439 ft
Hugh White State Park None 310 ft
Judge Magney State Park 30 1,461 ft
Rib Mountain State Park 30 1,850 ft
Leake County Water Park None 324 ft
Coal Bluff Park 60 335 ft
Castle Rock County Park 200 890 ft
Buckhorn State Park 54 885 ft
Brigham Park 25 1,364 ft
Walkiah Bluff Water Park None 38 ft
St. Bernard State Park None 3 ft
Blue Mound State Park None 1,522 ft
McFarland Lake - Grand Portage State Forest 5 1,479 ft
Riverfront City Park - Havana 12 473 ft
Fort Kaskaskia State Park None 598 ft
Dry Creek Water Park None 514 ft
Timberlake - Ross Barnett Reservoir 289 331 ft
Devilfish Lake - Grand Portage State Forest 5 1,904 ft
Canton Lake None 551 ft

Catastrophe Safeguard Index (CSI):


The Catastrophe Safeguard Index (CSI) recognizes that natural disaster risk, encompassing floods, fires, hurricanes, and tornadoes, can drastically affect safety and the overall appeal of an area. The level of natural disaster risk in a region significantly affects safety and the overall livability, with climate change amplifying these risks by potentially increasing the frequency and intensity of events like floods, fires, hurricanes, and tornadoes, thereby posing substantial challenges to community resilience and well-being.


Community Resilience Indicator (CRI): 2.0


The Community Resilience Indicator (CRI) recognizes that education, healthcare, and socioeconomics are crucial to the well-being of a region. The CRI acknowledges the profound impact of these elements on residents' overall quality of life. By evaluating educational resources, healthcare accessibility, and economic inclusivity, the index captures the essential aspects that contribute to a thriving community, fostering resident satisfaction, equity, and social cohesion.


Log Your Visit

When was your last visit to ?

Add a Photo

How was it? How were conditions?

Rate the


Submit

Leave A Review


Submit

Upload an Image


Favorite Limit Reached