Montville

Climate Recreation Community Catastrophe

Montville
Eden Index

Climate 7.0 Recreation 3.4 Community 1.2 Safeguard

4.3/10

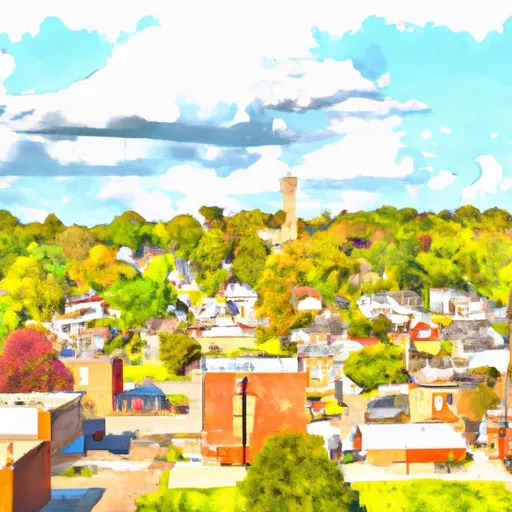
Montville, Ohio is a small town located in Geauga County, in the northeastern part of the state. The climate in Montville is classified as humid continental, characterized by four distinct seasons. Summers are typically warm and humid, with average temperatures ranging from the mid-70s to low 80s Fahrenheit, while winters tend to be cold and snowy, with average temperatures in the 20s and 30s Fahrenheit.

Montville is blessed with abundant water resources, with several rivers, streams, and lakes in the surrounding area. The hydrology constituents of Montville include the Grand River, which flows through the town, providing opportunities for fishing and boating enthusiasts. Additionally, there are numerous smaller streams and creeks that offer picturesque settings for outdoor activities like kayaking and canoeing.

Outdoor recreation opportunities in Montville are plentiful. The town is surrounded by beautiful natural landscapes, including forests and parks that are perfect for hiking, camping, and picnicking. The nearby Punderson State Park is a popular destination for outdoor enthusiasts, offering activities such as swimming, boating, fishing, and golfing. Montville is also home to several nature reserves and wildlife areas, providing opportunities for birdwatching and wildlife viewing.

In conclusion, Montville, Ohio offers a varied climate with distinct seasons, abundant water resources, and a range of outdoor recreation opportunities, making it an attractive destination for nature lovers and outdoor enthusiasts.

What is the Eden Index?

The Snoflo Eden Index serves as a comprehensive rating system for regions, evaluating their desirability through a holistic assessment of climate health, outdoor recreation opportunities, and natural disaster risk, acknowledging the profound impact of these factors on livability and well-being.


Climate Health Indicator (CHI): 7.0


Montville receives approximately 1205mm of rain per year, with humidity levels near 80% and air temperatures averaging around 9°C. Montville has a plant hardyness factor of 5, meaning plants and agriculture in this region thrive during a short period during spring and early summer. Most plants will die off during the colder winter months. By considering the ideal temperature range, reliable water supplies, clean air, and stable seasonal rain or snowpacks, the Climate Health Indicator (CHI) underscores the significance of a healthy climate as the foundation for quality living.

A healthy climate is paramount for ensuring a high quality of life and livability in a region, fostering both physical well-being and environmental harmony. This can be characterized by ideal temperatures, reliable access to water supplies, clean air, and consistent seasonal rain or snowpacks.


Weather Forecast


Streamflow Conditions

Southern Lake Erie

Area Rivers

Southern Lake Erie


Snowpack Depths

Southern Lake Erie


Reservoir Storage Capacity

Southern Lake Erie


Groundwater Levels


Recreational Opportunity Index (ROI): 3.4


The Recreational Opportunity Index (ROI) recognizes the value of outdoor recreational options, such as parks, hiking trails, camping sites, and fishing spots, while acknowledging that climate plays a pivotal role in ensuring the comfort and consistency of these experiences. Access to outdoor recreational opportunities, encompassing activities such as parks, hiking, camping, and fishing, is crucial for overall well-being, and the climate plays a pivotal role in enabling and enhancing these experiences, ensuring that individuals can engage in nature-based activities comfortably and consistently.


Catastrophe Safeguard Index (CSI):


The Catastrophe Safeguard Index (CSI) recognizes that natural disaster risk, encompassing floods, fires, hurricanes, and tornadoes, can drastically affect safety and the overall appeal of an area. The level of natural disaster risk in a region significantly affects safety and the overall livability, with climate change amplifying these risks by potentially increasing the frequency and intensity of events like floods, fires, hurricanes, and tornadoes, thereby posing substantial challenges to community resilience and well-being.


Community Resilience Indicator (CRI): 1.2


The Community Resilience Indicator (CRI) recognizes that education, healthcare, and socioeconomics are crucial to the well-being of a region. The CRI acknowledges the profound impact of these elements on residents' overall quality of life. By evaluating educational resources, healthcare accessibility, and economic inclusivity, the index captures the essential aspects that contribute to a thriving community, fostering resident satisfaction, equity, and social cohesion.


Log Your Visit

When was your last visit to ?

Add a Photo

How was it? How were conditions?

Rate the


Submit

Leave A Review


Submit

Upload an Image


Favorite Limit Reached