

-
 Snoflo Premium
Get unlimited access to all our content
With no Ad interruptions! - Start Your Free Trial Login with existing account
Senterville
Eden Index
Climate
8.3
•
Recreation
6.8
•
Community
0.5
•
Safeguard
5.8/10
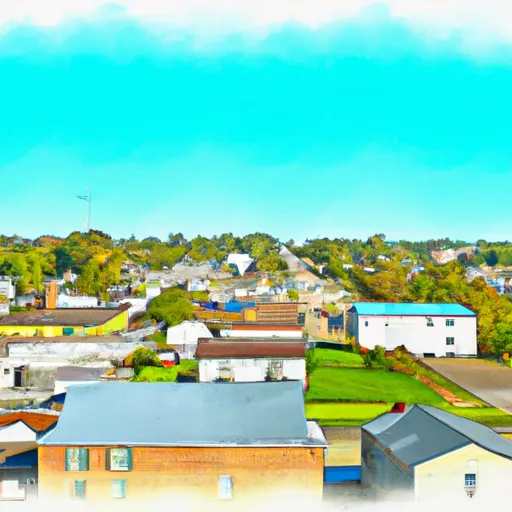
Senterville, Kentucky is a charming town located in the central part of the state. It experiences a moderate climate with warm summers and mild winters. The average annual temperature is around 55°F (13°C), with July being the hottest month and January being the coldest. The town receives a moderate amount of rainfall throughout the year, making the area lush and green.
Hydrologically, Senterville is surrounded by several water bodies, including rivers, lakes, and ponds. The most notable is the nearby Senterville Lake, which offers various recreational opportunities. The lake provides a serene setting for fishing enthusiasts to catch bass, catfish, and crappie. Boating and kayaking are also popular activities on the lake.
Outdoor recreation in Senterville extends beyond the lake. The town boasts numerous parks and trails that allow residents and visitors to enjoy nature. Senterville Park is a favorite spot for picnicking, sports, and walking trails. The Senterville Nature Preserve offers a more rustic experience, with hiking trails through forests and meadows, providing opportunities for birdwatching and wildlife observation.
In summary, Senterville, Kentucky offers a moderate climate, surrounded by water bodies, and provides various outdoor recreation opportunities such as fishing, boating, hiking, and birdwatching, making it an ideal destination for nature lovers and outdoor enthusiasts.
What is the Eden Index?
The Snoflo Eden Index serves as a comprehensive rating system for regions, evaluating their desirability through a holistic assessment of climate health, outdoor recreation opportunities, and natural disaster risk, acknowledging the profound impact of these factors on livability and well-being.
Climate Health Indicator (CHI): 8.3
Senterville receives approximately
1136mm of rain per year,
with humidity levels near 85%
and air temperatures averaging around
13°C.
Senterville has a plant hardyness factor of
6, meaning
plants and agriculture in this region thrive during a short period during spring and early summer. Most
plants will die off during the colder winter months.
By considering the ideal temperature range, reliable water supplies, clean air, and stable seasonal rain or snowpacks, the Climate Health Indicator (CHI) underscores the significance of a healthy climate as the foundation for quality living.
A healthy climate is paramount for ensuring a high quality of life and livability in a region, fostering both physical well-being and environmental harmony. This can be characterized by ideal temperatures, reliable access to water supplies, clean air, and consistent seasonal rain or snowpacks.
Weather Forecast
Streamflow Conditions
Big Sandy
Area Rivers
Big Sandy
Snowpack Depths
Big Sandy
Reservoir Storage Capacity
Big Sandy
Groundwater Levels
Recreational Opportunity Index (ROI): 6.8
The Recreational Opportunity Index (ROI) recognizes the value of outdoor recreational options, such as parks, hiking trails, camping sites, and fishing spots, while acknowledging that climate plays a pivotal role in ensuring the comfort and consistency of these experiences.
Access to outdoor recreational opportunities, encompassing activities such as parks, hiking, camping, and fishing, is crucial for overall well-being, and the climate plays a pivotal role in enabling and enhancing these experiences, ensuring that individuals can engage in nature-based activities comfortably and consistently.
Camping Areas
| Campground | Campsites | Reservations | Toilets | Showers | Elevation |
|---|---|---|---|---|---|
| Bark Camp | 71 | 2,839 ft | |||
| Persimmon Ridge City Park | 45 | 1,733 ft | |||
| Patience Park Toe River Campground | 86 | 2,677 ft | |||
| Black Mountain | 48 | 3,005 ft | |||
| Cabwaylingo State Forest | None | 1,161 ft | |||
| Rock Creek Rec Area | 80 | 2,348 ft | |||
| Curtis Creek | 14 | 1,876 ft | |||
| Warriors Path State Park | 134 | 1,326 ft | |||
| Carolina Hemlocks | 38 | 2,750 ft | |||
| Mount Mitchell State Park | 9 | 6,258 ft |
Nearby Ski Areas
Catastrophe Safeguard Index (CSI):
The Catastrophe Safeguard Index (CSI) recognizes that natural disaster risk, encompassing floods, fires, hurricanes, and tornadoes, can drastically affect safety and the overall appeal of an area.
The level of natural disaster risk in a region significantly affects safety and the overall livability, with climate change amplifying these risks by potentially increasing the frequency and intensity of events like floods, fires, hurricanes, and tornadoes, thereby posing substantial challenges to community resilience and well-being.
Community Resilience Indicator (CRI): 0.5
The Community Resilience Indicator (CRI) recognizes that education, healthcare, and socioeconomics are crucial to the well-being of a region. The CRI acknowledges the profound impact of these elements on residents' overall quality of life. By evaluating educational resources, healthcare accessibility, and economic inclusivity, the index captures the essential aspects that contribute to a thriving community, fostering resident satisfaction, equity, and social cohesion.