Tawas Point State Park
Community Reviews
Been here? Share the conditions.
Reviews, ratings & photos are added in the free Snoflo iOS app — rate a spot, tag the conditions, and your visit is verified by location. Add or manage your reviews from the app.

Tawas Point State Park
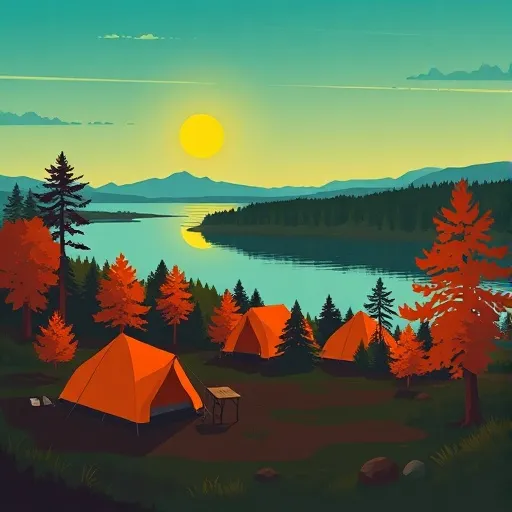
Tawas Point State Park is situated on a narrow peninsula that extends into Lake Huron, making it an ideal spot for outdoor enthusiasts and nature lovers. The park encompasses 183 acres, including a sandy beach, diverse habitats, and a historic lighthouse.
Reasons to visit Tawas Point State Park:
1. Natural Beauty: The park's pristine beach and dune ecosystem, along with its lush greenery and stunning views of Lake Huron, make it a perfect place for relaxation and enjoyment of nature.
2. Birdwatching: Tawas Point is renowned as a prime location for birdwatching, particularly during the spring and fall migration seasons. Over 300 species of birds have been recorded in the park, including rare sightings.
3. Lighthouse Experience: The Tawas Point Lighthouse, built in 1876, is a historic gem within the park. Visitors can explore the lighthouse, learn about its fascinating history, and enjoy panoramic views from the top of the tower.
Points of interest in Tawas Point State Park:
1. Tawas Point Lighthouse: The iconic lighthouse is a must-visit attraction within the park. It has been fully restored and offers guided tours, providing insights into its past and the vital role it played in maritime navigation.
2. Beach and Picnic Areas: The park features a sandy beach where visitors can swim, sunbathe, and enjoy various water activities. Picnic areas with tables and grills are also available, offering a perfect setting for family gatherings or peaceful lunches.
3. Nature Trails: Tawas Point offers several hiking trails that wind through diverse habitats, providing opportunities to observe wildlife and native plants.
Interesting facts about Tawas Point State Park:
1. Dark Sky Park: Tawas Point was designated as a Dark Sky Park in 2016, making it an excellent spot for stargazing and astrophotography.
2. Preserving Maritime History: The lighthouse and the surrounding area have witnessed numerous shipwrecks throughout history. The park aims to preserve and commemorate this rich maritime heritage.
3. Nature Conservancy: Tawas Point State Park is a designated "Important Bird Area" by the National Audubon Society, highlighting its significance for bird conservation.
Best time of year to visit Tawas Point State Park:
The park is open year-round, each season offering unique experiences. Spring and fall are particularly popular due to the bird migration, while summer allows visitors to enjoy the beach, swimming, and picnicking. Winter activities, such as cross-country skiing and snowshoeing, are available as well.
Please note that conditions and availability may vary, so it is advisable to consult official sources and local park websites for the most accurate and up-to-date information before planning your visit to Tawas Point State Park.
Camping in Tawas Point State Park
Campgrounds inside the park, with today's conditions score.
Points of interest in Tawas Point State Park
Landmarks and points of interest inside the park boundary.

Plan your visit down to the hour
Same weather feed Snoflo's iOS app uses -- updated continuously from NOAA / yr.no.
Next 5 days, hour by hour
Temperature line with weather symbols on top, snow + rain accumulation as columns, humidity as a dotted line.
5-day forecast table
Every 3 hours, broken out across temperature, snow, rain, humidity, and wind.
| Time | Condition | Temp (°F) | Snow (in) | Rain (in) | Humidity (%) | Wind (mps) | Wind dir |
|---|---|---|---|---|---|---|---|
| Loading detailed forecast… | |||||||
15-day temperature & precipitation
Daily temperatures, snow, and rain projected over the next two weeks.
Responsible recreation & Leave No Trace
- Know before you go
- Check the operator's site for hours, permit requirements, seasonal closures, and fire restrictions before heading out.
- Stay on trail
- Stick to marked paths to protect vegetation, prevent erosion, and avoid disturbing wildlife habitat.
- Respect wildlife
- Observe from a distance, never feed wildlife, and store food securely if camping is permitted on-site.
- Pack it in, pack it out
- Carry out all trash, food scraps, and gear. Many parks have limited or no trash service.
- Leave what you find
- Don't take rocks, plants, or artifacts. They make the park what it is for the next visitor.
Set push alerts in the Snoflo app
Save Tawas Point State Park as a favorite, set a custom threshold (precipitation, freezing temperatures, fire-restriction days), and the iOS app will push the moment conditions cross.
About Tawas Point State Park
What can I do at Tawas Point State Park?
Most Snoflo-tracked parks support hiking, picnicking, and wildlife viewing. Check the operator's site for activity-specific rules (camping, fishing, paddling, hunting).
How fresh is the weather data?
The hourly forecast updates throughout the day from NOAA / yr.no. Streamflow comes live from USGS streamgauges.
When is the best time to visit?
Use the 15-day temperature & precipitation outlook on this page to plan -- pick a window with comfortable temperatures and low precipitation.
How do I get to Tawas Point State Park?
Tap Directions in the hero above to open driving directions in Google Maps, or Open in map to center the Snoflo interactive map on the park.
Can I get alerts when conditions change?
Yes -- alerts are managed in the Snoflo iOS app. Favorite this park, set a threshold (temperature, precipitation), and you'll get a push the moment it crosses.
Park & land designation reference
A quick legend for the federal and state land categories Snoflo tracks. Each designation comes with different rules around access, recreation, and resource extraction.
- National Park
- Large protected natural areas managed by the federal government to preserve significant landscapes, ecosystems, and cultural resources; recreation is allowed but conservation is the priority.
- State Park
- Public natural or recreational areas managed by a state government, typically smaller than national parks and focused on regional natural features, recreation, and education.
- Local Park
- Community-level parks managed by cities or counties, emphasizing recreation, playgrounds, sports, and green space close to populated areas.
- Wilderness Area
- The highest level of land protection in the U.S.; designated areas where nature is left essentially untouched, with no roads, structures, or motorized motorized access permitted.
- National Recreation Area
- Areas set aside primarily for outdoor recreation (boating, hiking, fishing, often around reservoirs, rivers, or scenic landscapes); may allow more development.
- National Conservation Area (BLM)
- BLM-managed areas with special ecological, cultural, or scientific value; more protection than typical BLM land but less strict than Wilderness Areas.
- State Forest
- State-managed forests focused on habitat, watershed, recreation, and sustainable timber harvest.
- Bureau of Land Management (BLM) Land
- Vast federal lands managed for mixed use -- recreation, grazing, mining, conservation -- with fewer restrictions than national parks or forests.