High Wind Warning
2026-10-23T15:00:00-06:00

* WHAT...Northwest winds 35 to 45 mph, with gusts up to 65 mph expected. * WHERE...Eastern Glacier, Western Toole, and Central Pondera, Eastern Toole and Liberty, and Hill County. * WHEN...From 11 AM this morning to 3 PM MDT this afternoon. * IMPACTS...Damaging winds will blow down trees and power lines. Widespread power outages are expected. Travel will be difficult, especially for high profile vehicles.
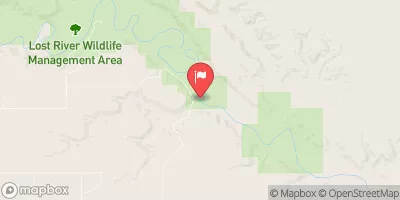
Milk River At Eastern Crossing Of Int Bndry Historical Data

Historical Data


Streamflow Range


Date Average 2026 2025 2024 2023 2022 2021 2020 2019 2018 2017 2016 2015 2014 2013 2012 2011
03-01 376.25
03-02 419.5
03-03 455.0
03-04 450.0
03-05 359.0
03-06 377.0
03-07 364.0
03-08 326.0
03-09 284.0
03-10 263.0
03-11 273.0
03-12 242.0
03-13 235.0
03-14 392.5
03-15 244.75
03-16 216.0
03-17 245.75
03-18 499.17
03-19 430.83
03-20 486.11
03-21 394.75
03-22 352.25
03-23 276.96
03-24 211.06
03-25 246.56
03-26 211.07
03-27 196.7
03-28 275.7
03-29 338.38
03-30 276.07
03-31 304.47
04-01 260.73
04-02 283.48
04-03 297.33
04-04 313.28
04-05 332.9
04-06 338.9
04-07 317.07
04-08 333.08
04-09 337.95
04-10 367.36
04-11 381.0
04-12 462.3
04-13 415.91
04-14 438.36
04-15 398.37
04-16 385.93
04-17 391.63
04-18 650.5
04-19 566.23
04-20 530.38
04-21 483.64
04-22 527.79
04-23 550.57
04-24 612.57
04-25 567.31
04-26 600.29
04-27 561.29
04-28 536.74
04-29 529.49
04-30 526.36
05-01 575.38
05-02 569.11
05-03 560.19
05-04 551.44
05-05 540.05
05-06 529.03
05-07 515.76
05-08 518.4
05-09 519.64
05-10 489.8
05-11 554.62
05-12 565.25
05-13 596.15
05-14 602.59
05-15 598.43
05-16 602.64
05-17 604.43
05-18 546.77
05-19 559.69
05-20 574.57
05-21 564.33
05-22 645.63
05-23 674.39
05-24 682.92
05-25 669.64
05-26 646.04
05-27 735.33
05-28 774.23
05-29 734.23
05-30 772.46
05-31 745.55
06-01 685.47
06-02 651.95
06-03 671.85
06-04 878.31
06-05 744.65
06-06 707.84
06-07 692.32
06-08 671.6
06-09 625.86
06-10 789.42
06-11 780.84
06-12 777.86
06-13 715.4
06-14 691.84
06-15 672.41
06-16 620.35
06-17 591.86
06-18 619.74
06-19 632.24
06-20 684.67
06-21 916.38
06-22 838.18
06-23 783.21
06-24 753.24
06-25 715.66
06-26 637.94
06-27 631.9
06-28 625.65
06-29 627.28
06-30 566.08
07-01 577.39
07-02 576.81
07-03 576.04
07-04 554.1
07-05 588.13
07-06 592.67
07-07 581.71
07-08 599.93
07-09 570.43
07-10 549.87
07-11 526.53
07-12 523.84
07-13 506.54
07-14 503.09
07-15 499.83
07-16 493.06
07-17 466.79
07-18 463.59
07-19 464.99
07-20 454.57
07-21 459.89
07-22 445.89
07-23 446.85
07-24 447.47
07-25 436.55
07-26 451.41
07-27 450.37
07-28 455.84
07-29 454.07
07-30 452.71
07-31 450.4
08-01 459.77
08-02 454.81
08-03 444.37
08-04 463.89
08-05 450.09
08-06 458.73
08-07 471.02
08-08 465.32
08-09 482.94
08-10 495.06
08-11 485.48
08-12 488.96
08-13 493.29
08-14 486.64
08-15 486.55
08-16 475.21
08-17 478.89
08-18 476.71
08-19 475.42
08-20 475.12
08-21 470.41
08-22 470.11
08-23 503.02
08-24 478.73
08-25 484.3
08-26 475.08
08-27 462.44
08-28 466.16
08-29 450.42
08-30 439.74
08-31 431.2
09-01 420.92
09-02 402.31
09-03 410.19
09-04 379.75
09-05 376.57
09-06 364.73
09-07 368.2
09-08 390.65
09-09 418.76
09-10 371.03
09-11 364.5
09-12 368.73
09-13 370.01
09-14 361.76
09-15 345.93
09-16 334.1
09-17 322.78
09-18 307.19
09-19 285.27
09-20 270.99
09-21 264.28
09-22 268.06
09-23 233.67
09-24 216.96
09-25 199.6
09-26 185.7
09-27 169.73
09-28 158.63
09-29 154.6
09-30 146.58
10-01 97.36
10-02 114.38
10-03 111.52
10-04 107.61
10-05 108.21
10-06 102.0
10-07 99.96
10-08 100.03
10-09 95.58
10-10 88.31
10-11 80.96
10-12 77.32
10-13 70.67
10-14 65.62
10-15 70.24
10-16 64.09
10-17 54.72
10-18 49.5
10-19 107.57
10-20 78.38
10-21 93.63
10-22 99.03
10-23 52.12
10-24 59.04
10-25 55.95
10-26 56.4
10-27 56.47
10-28 49.71
10-29 57.85
10-30 53.78
10-31 51.03
11-01 44.38
11-02 61.08
11-03 99.28
11-04 128.55
11-05 133.55
11-06 119.4

Annual Peak Streamflow


Seasonal Comparison


Oceanic Nino Index