Flood Watch
2026-11-07T10:00:00-05:00

* WHAT...Flooding caused by excessive rainfall continues to be possible. * WHERE...Portions of southeastern Massachusetts, including the following areas, Barnstable, Dukes, Plymouth and Bristol counties, and Rhode Island, including the following areas, Block Island, Bristol, Kent, Newport, Providence and Washington counties. * WHEN...From 4 AM EST early this morning through Saturday morning. * IMPACTS...Excessive runoff may result in flooding of rivers, creeks, streams, and other low-lying and flood-prone locations. Flooding may occur in poor drainage and urban areas. Storm drains and ditches may become clogged with debris. * ADDITIONAL DETAILS... - Periods of heavy rain today through Saturday morning may result in an area of 2 to 4 inches of rainfall across RI and Southeast MA, with a low risk (less than 30 percent) of isolated amounts of 5 to 6 inches. - http://www.weather.gov/safety/flood
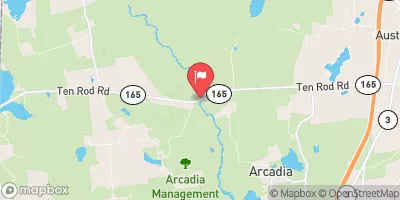
Wood River Near Arcadia, Ri Historical Data

Historical Data


Streamflow Range


Date Average 2026 2025 2024 2023 2022 2021 2020 2019 2018 2017 2016 2015 2014 2013 2012 2011
01-01 104.74
01-02 95.05
01-03 91.7
01-04 86.45
01-05 81.84
01-06 84.37
01-07 84.87
01-08 78.04
01-09 75.23
01-10 107.04
01-11 138.89
01-12 117.59
01-13 117.95
01-14 131.17
01-15 117.96
01-16 103.36
01-17 110.26
01-18 95.13
01-19 100.15
01-20 99.77
01-21 94.61
01-22 88.13
01-23 87.23
01-24 100.68
01-25 130.2
01-26 141.72
01-27 137.35
01-28 120.81
01-29 110.33
01-30 97.18
01-31 86.25
02-01 85.93
02-02 82.94
02-03 79.34
02-04 78.01
02-05 90.31
02-06 85.72
02-07 87.33
02-08 91.18
02-09 85.24
02-10 83.78
02-11 79.22
02-12 86.51
02-13 86.94
02-14 67.08
02-15 74.72
02-16 74.12
02-17 88.66
02-18 89.19
02-19 72.74
02-20 85.36
02-21 78.39
02-22 74.48
02-23 92.84
02-24 96.37
02-25 101.32
02-26 99.58
02-27 103.42
02-28 116.56
02-29 105.2
03-01 108.74
03-02 107.5
03-03 140.62
03-04 128.46
03-05 115.45
03-06 111.61
03-07 114.36
03-08 121.87
03-09 112.14
03-10 112.35
03-11 125.25
03-12 122.41
03-13 121.96
03-14 120.52
03-15 133.96
03-16 127.66
03-17 128.67
03-18 133.75
03-19 117.8
03-20 112.07
03-21 106.65
03-22 102.5
03-23 101.98
03-24 144.63
03-25 128.09
03-26 114.53
03-27 109.69
03-28 108.55
03-29 122.13
03-30 117.29
03-31 144.88
04-01 136.74
04-02 139.41
04-03 123.87
04-04 128.68
04-05 131.96
04-06 120.67
04-07 116.61
04-08 122.64
04-09 120.43
04-10 111.69
04-11 103.79
04-12 91.98
04-13 90.73
04-14 107.62
04-15 105.64
04-16 109.85
04-17 121.84
04-18 117.08
04-19 107.97
04-20 104.4
04-21 108.54
04-22 104.49
04-23 102.73
04-24 106.99
04-25 98.77
04-26 105.42
04-27 121.29
04-28 112.07
04-29 98.58
04-30 92.4
05-01 104.47
05-02 114.16
05-03 103.77
05-04 96.22
05-05 91.54
05-06 102.18
05-07 101.59
05-08 88.09
05-09 84.62
05-10 94.02
05-11 89.92
05-12 84.94
05-13 80.21
05-14 68.07
05-15 70.79
05-16 73.31
05-17 76.34
05-18 76.31
05-19 77.21
05-20 74.08
05-21 82.73
05-22 73.21
05-23 80.05
05-24 74.05
05-25 75.33
05-26 72.47
05-27 65.97
05-28 63.27
05-29 62.73
05-30 61.81
05-31 67.21
06-01 63.92
06-02 58.15
06-03 58.39
06-04 55.47
06-05 52.36
06-06 52.17
06-07 51.69
06-08 59.75
06-09 71.24
06-10 66.03
06-11 62.79
06-12 68.05
06-13 71.61
06-14 71.6
06-15 71.83
06-16 63.33
06-17 60.56
06-18 57.91
06-19 57.41
06-20 54.33
06-21 48.8
06-22 50.84
06-23 48.19
06-24 48.09
06-25 46.18
06-26 44.73
06-27 41.4
06-28 45.85
06-29 48.81
06-30 41.86
07-01 38.76
07-02 42.06
07-03 41.19
07-04 39.52
07-05 42.38
07-06 37.07
07-07 40.69
07-08 38.52
07-09 39.21
07-10 55.21
07-11 42.14
07-12 60.91
07-13 47.89
07-14 47.01
07-15 44.47
07-16 41.76
07-17 52.35
07-18 41.21
07-19 38.6
07-20 33.37
07-21 32.07
07-22 31.29
07-23 31.59
07-24 30.56
07-25 28.89
07-26 29.0
07-27 28.74
07-28 27.27
07-29 26.15
07-30 27.15
07-31 27.7
08-01 25.58
08-02 21.82
08-03 22.62
08-04 38.49
08-05 33.12
08-06 29.64
08-07 26.28
08-08 30.93
08-09 24.48
08-10 25.79
08-11 26.02
08-12 23.36
08-13 20.59
08-14 26.23
08-15 23.9
08-16 37.93
08-17 34.72
08-18 30.65
08-19 31.16
08-20 28.26
08-21 26.55
08-22 23.63
08-23 25.67
08-24 23.71
08-25 21.36
08-26 21.0
08-27 18.36
08-28 19.77
08-29 30.32
08-30 29.47
08-31 27.18
09-01 23.17
09-02 37.83
09-03 42.37
09-04 34.33
09-05 28.48
09-06 32.38
09-07 35.06
09-08 31.83
09-09 41.13
09-10 36.37
09-11 31.96
09-12 26.99
09-13 26.68
09-14 47.81
09-15 39.84
09-16 32.4
09-17 28.82
09-18 24.72
09-19 29.8
09-20 27.76
09-21 24.99
09-22 23.52
09-23 21.22
09-24 20.64
09-25 21.2
09-26 39.4
09-27 43.21
09-28 47.1
09-29 45.91
09-30 40.99
10-01 33.93
10-02 28.1
10-03 26.68
10-04 23.74
10-05 31.92
10-06 26.53
10-07 29.8
10-08 28.57
10-09 28.09
10-10 27.98
10-11 26.22
10-12 38.03
10-13 41.28
10-14 43.17
10-15 40.34
10-16 33.55
10-17 45.27
10-18 38.51
10-19 37.37
10-20 34.66
10-21 49.71
10-22 56.21
10-23 46.92
10-24 42.5
10-25 39.37
10-26 39.43
10-27 41.08
10-28 45.86
10-29 43.13
10-30 73.43
10-31 62.98
11-01 61.59
11-02 60.01
11-03 53.6
11-04 55.97
11-05 50.43
11-06 44.02
11-07 48.16
11-08 47.36
11-09 45.7
11-10 51.56
11-11 48.45
11-12 46.98
11-13 53.49
11-14 58.61
11-15 54.33
11-16 58.19
11-17 60.64
11-18 62.55
11-19 58.49
11-20 56.92
11-21 55.09
11-22 49.42
11-23 53.78
11-24 57.88
11-25 64.57
11-26 63.19
11-27 74.41
11-28 84.92
11-29 67.08
11-30 65.96
12-01 75.55
12-02 77.66
12-03 77.09
12-04 69.37
12-05 63.24
12-06 74.84
12-07 75.47
12-08 89.38
12-09 95.32
12-10 99.84
12-11 98.66
12-12 110.61
12-13 95.27
12-14 86.81
12-15 88.89
12-16 89.22
12-17 87.2
12-18 92.95
12-19 135.93
12-20 115.4
12-21 99.45
12-22 105.38
12-23 102.94
12-24 113.58
12-25 108.66
12-26 119.76
12-27 107.06
12-28 106.02
12-29 112.66
12-30 104.66
12-31 106.0

Annual Peak Streamflow


Seasonal Comparison


Oceanic Nino Index