Casitas Reservoir
As of July 24, 2026, Casitas is holding 236,844 acre-ft of water — 148% of normal storage for this date. Storage data refreshed throughout the day.

Casitas
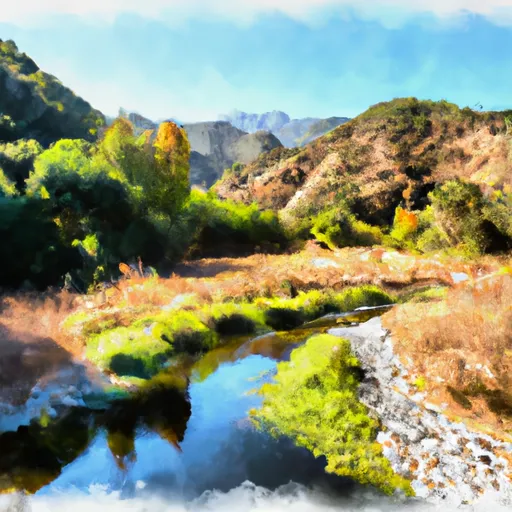
Casitas in California refer to small, artificially created reservoirs or lakes primarily used for hydroelectric power generation, irrigation, and recreation. The history of these reservoirs dates back to the early 1900s when the demand for water in the region increased due to the growth of agriculture and urbanization. Today, Casitas are managed and operated by various agencies such as Ventura County Watershed Protection District and Casitas Municipal Water District. These agencies are responsible for ensuring the availability of water supply to the residents of the region. Furthermore, Casitas receive water from both surface flow and snowpack providers such as the Santa Ana River and the Ventura River. The reservoirs are also used for recreational purposes such as boating, swimming, and fishing, while the surrounding agricultural lands rely on the reservoirs for irrigation.
Daily levels at Casitas
Storage volume, pool elevation, and total release plotted from the operating agency's daily observations.
Storage
acre-ft · code 2
Pool Elevation
ft · code 1
Plan around the weather
Same NOAA / yr.no feed Snoflo's iOS app uses. Watch the precipitation column on the meteogram -- rain on the basin upstream typically lifts inflow 24-72 hours later.
Next 5 days, hour by hour
Temperature line with weather symbols on top, snow + rain accumulation as columns, humidity as a dotted line.
5-day forecast table
Every 3 hours, broken out across temperature, snow, rain, humidity, and wind. Each cell is colour-coded relative to the column min/max.
| Time | Condition | Temp (°F) | Snow (in) | Rain (in) | Humidity (%) | Wind (mps) | Wind dir |
|---|---|---|---|---|---|---|---|
| Loading detailed forecast… | |||||||
15-day temperature & precipitation
Daily temperatures, snow, and rain projected over the next two weeks.
Nearby streamflow gauges
USGS streamgauges around Casitas -- inflows here typically show up in storage 24-72 hours later.
| Streamgauge | Discharge | View |
|---|---|---|
| Ventura R Nr Ventura | 12 cfs | → |
| Carpinteria C Nr Carpinteria Ca | · | → |
| Matilija C Nr Res Nr Matilija Hot Springs Ca | 2 cfs | → |
| Santa Paula C Nr Santa Paula | 6 cfs | → |
| Sespe Creek Near Wheeler Springs Ca | 0 cfs | → |
| Calleguas C Nr Camarillo Ca | 6 cfs | → |
Make a day of it
Boat launches, lakeside camping, fishing access, and other reservoirs near Casitas.
Boat launches
See all →


Fishing spots
See all →
River runs
See all →


About Casitas
Where does the data for Casitas come from?
Daily storage, pool elevation, and release rates are sourced from USGS, USBR, and USACE monitoring stations. Weather forecast comes from NOAA / yr.no -- the same feed Snoflo's iOS app uses.
How often is the report updated?
Storage observations are updated daily by the operating agency. The 15-day weather forecast refreshes throughout the day. Snoflo caches and renders the most recent observation -- check the "as of" timestamp on the storage card.
What does the Hazard hazard rating mean?
The Corps of Engineers' hazard potential classification grades probable consequences if the dam fails: High = probable loss of human life; Significant = no probable loss of human life but possible economic loss / environmental damage; Low = no probable loss of human life, only minor economic / environmental losses. See the Dam Data Reference card below for the full definitions.
What's "% of normal"?
The current storage value compared to the historical average storage on this calendar day. 100% = right on average; values above 100% mean above-normal storage (wet year); values below mean below-normal (dry year or drought).
Can I get alerts when storage crosses a threshold?
Yes -- alerts are managed in the Snoflo iOS app. Favorite this reservoir, set a threshold, and you'll get a push the moment conditions cross.