Charles Mill Dam Dam

Charles Mill Dam
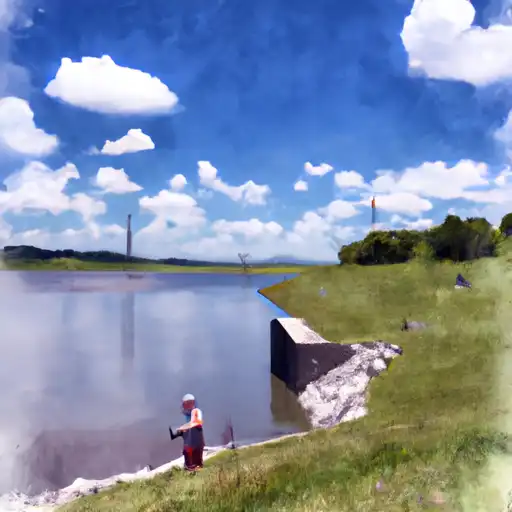
Charles Mill Dam, located in Ashland, Ohio, along the Black Fork of the Mohican River, was completed in 1936 by the US Army Corps of Engineers for flood risk reduction. This earth dam, with a hydraulic height of 38 feet and a structural height of 52 feet, spans 1390 feet and has a storage capacity of 88,000 acre-feet. The dam also serves purposes such as fish and wildlife pond creation and recreational activities.
Despite its high hazard potential, the dam is well-managed by the US Army Corps of Engineers, with regular inspections and emergency preparedness measures in place. The agency continuously monitors the dam's condition and engages with local emergency managers to develop response plans in case of an emergency. The dam's risk management measures include prioritizing activities to mitigate risks, updating the emergency action plan regularly, and performing necessary maintenance and repairs to ensure the dam's proper functioning.
In the face of increasing climate variability and severe weather events, the Charles Mill Dam plays a crucial role in managing water levels and reducing flood risks in the region. As part of the USACE's ongoing efforts to address flood risks associated with dams, the dam serves as a vital resource for water resource and climate enthusiasts interested in sustainable water management practices.
Plan around the weather
Same NOAA / yr.no feed Snoflo's iOS app uses. Watch the precipitation column on the meteogram -- rain on the basin upstream typically lifts inflow 24-72 hours later.
Next 5 days, hour by hour
Temperature line with weather symbols on top, snow + rain accumulation as columns, humidity as a dotted line.
5-day forecast table
Every 3 hours, broken out across temperature, snow, rain, humidity, and wind. Each cell is colour-coded relative to the column min/max.
| Time | Condition | Temp (°F) | Snow (in) | Rain (in) | Humidity (%) | Wind (mps) | Wind dir |
|---|---|---|---|---|---|---|---|
| Loading detailed forecast… | |||||||
15-day temperature & precipitation
Daily temperatures, snow, and rain projected over the next two weeks.
Nearby streamflow gauges
USGS streamgauges around Charles Mill Dam -- inflows here typically show up in storage 24-72 hours later.
| Streamgauge | Discharge | View |
|---|---|---|
| Clear Fork Mohican River At Bellville Oh | 93 cfs | → |
| Black Fork Mohican River At Shelby Oh | 1 cfs | → |
| Kokosing River At Mount Vernon Oh | 53 cfs | → |
| Killbuck Creek At Killbuck Oh | 133 cfs | → |
| Whetstone Creek At Mt Gilead Oh | 0 cfs | → |
| Chippewa Creek At Miller Rd At Sterling Oh | 2 cfs | → |


About Charles Mill Dam
Where does the data for Charles Mill Dam come from?
Structural and regulatory data come from the U.S. Army Corps of Engineers' National Inventory of Dams (NID). Weather forecast comes from NOAA / yr.no -- the same feed Snoflo's iOS app uses.
How often is the report updated?
NID structural data refreshes annually as the Corps publishes updated assessments. The weather forecast refreshes throughout the day.
What does the High hazard rating mean?
The Corps of Engineers' hazard potential classification grades probable consequences if the dam fails: High = probable loss of human life; Significant = no probable loss of human life but possible economic loss / environmental damage; Low = no probable loss of human life, only minor economic / environmental losses. See the Dam Data Reference card below for the full definitions.
What's "% of normal"?
The current storage value compared to the historical average storage on this calendar day. 100% = right on average; values above 100% mean above-normal storage (wet year); values below mean below-normal (dry year or drought).
Can I get alerts when storage crosses a threshold?
Yes -- alerts are managed in the Snoflo iOS app. Favorite this dam, set a threshold, and you'll get a push the moment conditions cross.
Dam data reference
Condition Assessment
- Satisfactory
- No existing or potential dam safety deficiencies are recognized. Acceptable performance is expected under all loading conditions (static, hydrologic, seismic) in accordance with the minimum applicable state or federal regulatory criteria or tolerable risk guidelines.
- Fair
- No existing dam safety deficiencies are recognized for normal operating conditions. Rare or extreme hydrologic and/or seismic events may result in a dam safety deficiency. Risk may be in the range to take further action.
- Poor
- A dam safety deficiency is recognized for normal operating conditions which may realistically occur. Remedial action is necessary. POOR may also be used when uncertainties exist as to critical analysis parameters which identify a potential dam safety deficiency.
- Unsatisfactory
- A dam safety deficiency is recognized that requires immediate or emergency remedial action for problem resolution.
- Not Rated
- The dam has not been inspected, is not under state or federal jurisdiction, or has been inspected but, for whatever reason, has not been rated.
Hazard Potential Classification
- High
- Dams assigned the high hazard potential classification are those where failure or mis-operation will probably cause loss of human life.
- Significant
- Dams assigned the significant hazard potential classification are those dams where failure or mis-operation results in no probable loss of human life but can cause economic loss, environmental damage, disruption of lifeline facilities, or impact other concerns. Significant hazard potential classification dams are often located in predominantly rural or agricultural areas but could be in areas with population and significant infrastructure.
- Low
- Dams assigned the low hazard potential classification are those where failure or mis-operation results in no probable loss of human life and low economic and/or environmental losses. Losses are principally limited to the owner's property.
- Undetermined
- Dams for which a downstream hazard potential has not been designated or is not provided.