Tampa

Climate Recreation Community Catastrophe

Tampa
Eden Index

Climate 6.8 Recreation 4.8 Community 2.5 Safeguard

5.0/10

Tampa is a city located on the west coast of Florida, known for its warm and humid climate, diverse hydrology constituents, and abundant outdoor recreation opportunities. The city experiences a tropical savanna climate, characterized by hot summers with temperatures averaging around 90°F (32°C) and mild winters with temperatures around 70°F (21°C). Rainfall is abundant throughout the year, with the wettest months being June through September, making Tampa susceptible to occasional thunderstorms and tropical storms during hurricane season.

Tampa's hydrology constituents include the Hillsborough River, which flows through the city and provides a range of recreational activities such as kayaking, fishing, and boating. The city is also surrounded by the Tampa Bay, offering opportunities for swimming, jet skiing, and sailing. With its proximity to the Gulf of Mexico, Tampa is a popular destination for beach enthusiasts, with stunning sandy beaches and clear turquoise waters.

For outdoor enthusiasts, Tampa boasts numerous parks and nature preserves, such as the stunning Lettuce Lake Park and the expansive Alafia River State Park, where visitors can engage in activities like hiking, biking, bird watching, and camping. Additionally, Tampa is home to the renowned Busch Gardens theme park, which combines thrilling rides with captivating wildlife exhibits.

In conclusion, Tampa offers a tropical climate, diverse hydrology constituents, and a plethora of outdoor recreation opportunities, making it an ideal destination for those seeking warm weather adventures and immersive nature experiences.

What is the Eden Index?

The Snoflo Eden Index serves as a comprehensive rating system for regions, evaluating their desirability through a holistic assessment of climate health, outdoor recreation opportunities, and natural disaster risk, acknowledging the profound impact of these factors on livability and well-being.


Climate Health Indicator (CHI): 6.8


Tampa receives approximately 1254mm of rain per year, with humidity levels near 86% and air temperatures averaging around 23°C. Tampa has a plant hardyness factor of 9, meaning plants and agriculture in this region tend to thrive here all year round.
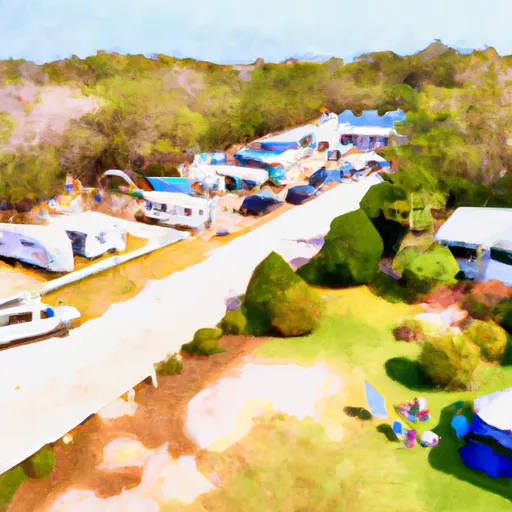
 By considering the ideal temperature range, reliable water supplies, clean air, and stable seasonal rain or snowpacks, the Climate Health Indicator (CHI) underscores the significance of a healthy climate as the foundation for quality living.

A healthy climate is paramount for ensuring a high quality of life and livability in a region, fostering both physical well-being and environmental harmony. This can be characterized by ideal temperatures, reliable access to water supplies, clean air, and consistent seasonal rain or snowpacks.


Weather Forecast


Streamflow Conditions

Tampa Bay

Area Rivers

Tampa Bay


Snowpack Depths

Tampa Bay


Reservoir Storage Capacity

Tampa Bay


Groundwater Levels


Recreational Opportunity Index (ROI): 4.8


The Recreational Opportunity Index (ROI) recognizes the value of outdoor recreational options, such as parks, hiking trails, camping sites, and fishing spots, while acknowledging that climate plays a pivotal role in ensuring the comfort and consistency of these experiences. Access to outdoor recreational opportunities, encompassing activities such as parks, hiking, camping, and fishing, is crucial for overall well-being, and the climate plays a pivotal role in enabling and enhancing these experiences, ensuring that individuals can engage in nature-based activities comfortably and consistently.


Catastrophe Safeguard Index (CSI):


The Catastrophe Safeguard Index (CSI) recognizes that natural disaster risk, encompassing floods, fires, hurricanes, and tornadoes, can drastically affect safety and the overall appeal of an area. The level of natural disaster risk in a region significantly affects safety and the overall livability, with climate change amplifying these risks by potentially increasing the frequency and intensity of events like floods, fires, hurricanes, and tornadoes, thereby posing substantial challenges to community resilience and well-being.


Community Resilience Indicator (CRI): 2.5


The Community Resilience Indicator (CRI) recognizes that education, healthcare, and socioeconomics are crucial to the well-being of a region. The CRI acknowledges the profound impact of these elements on residents' overall quality of life. By evaluating educational resources, healthcare accessibility, and economic inclusivity, the index captures the essential aspects that contribute to a thriving community, fostering resident satisfaction, equity, and social cohesion.


Log Your Visit

When was your last visit to ?

Add a Photo

How was it? How were conditions?

Rate the


Submit

Leave A Review


Submit

Upload an Image


Favorite Limit Reached