-
Snoflo Premium
Get unlimited access to all our content
With no Ad interruptions! - Start Your Free Trial Login with existing account
Davenport
Eden Index
Climate
8.2
•
Recreation
3.1
•
Community
1.1
•
Safeguard
4.6/10
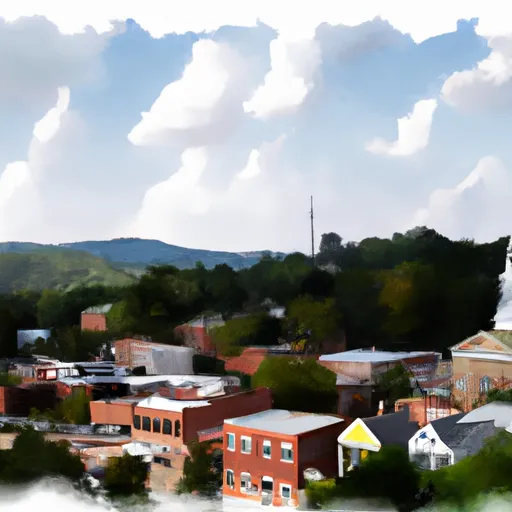
Davenport is a small town located in Buchanan County, Virginia. The climate in Davenport is typically characterized by mild to cool winters and warm summers with moderate precipitation throughout the year. The hydrology constituents in the area are dominated by the Levisa Fork River, which runs through the town and provides opportunities for fishing and boating. The surrounding forests offer ample opportunities for hiking, camping, and wildlife viewing. Other popular outdoor recreation activities include hunting, off-roading, and ATV riding. Overall, Davenport is an ideal destination for those seeking outdoor adventure in a scenic and peaceful setting.
What is the Eden Index?
The Snoflo Eden Index serves as a comprehensive rating system for regions, evaluating their desirability through a holistic assessment of climate health, outdoor recreation opportunities, and natural disaster risk, acknowledging the profound impact of these factors on livability and well-being.
Climate Health Indicator (CHI): 8.2
Davenport receives approximately
1190mm of rain per year,
with humidity levels near 85%
and air temperatures averaging around
12°C.
Davenport has a plant hardyness factor of
6, meaning
plants and agriculture in this region thrive during a short period during spring and early summer. Most
plants will die off during the colder winter months.
By considering the ideal temperature range, reliable water supplies, clean air, and stable seasonal rain or snowpacks, the Climate Health Indicator (CHI) underscores the significance of a healthy climate as the foundation for quality living.
A healthy climate is paramount for ensuring a high quality of life and livability in a region, fostering both physical well-being and environmental harmony. This can be characterized by ideal temperatures, reliable access to water supplies, clean air, and consistent seasonal rain or snowpacks.
Weather Forecast
Streamflow Conditions
Big Sandy
Area Rivers
Big Sandy
Snowpack Depths
Big Sandy
Reservoir Storage Capacity
Big Sandy
Groundwater Levels
Recreational Opportunity Index (ROI): 3.1
The Recreational Opportunity Index (ROI) recognizes the value of outdoor recreational options, such as parks, hiking trails, camping sites, and fishing spots, while acknowledging that climate plays a pivotal role in ensuring the comfort and consistency of these experiences.
Access to outdoor recreational opportunities, encompassing activities such as parks, hiking, camping, and fishing, is crucial for overall well-being, and the climate plays a pivotal role in enabling and enhancing these experiences, ensuring that individuals can engage in nature-based activities comfortably and consistently.
Camping Areas
Campground | Campsites | Reservations | Toilets | Showers | Elevation |
---|---|---|---|---|---|
Chief Logan State Park | None | 693 ft | |||
Low Gap Camp | 5 | 3,918 ft | |||
Breaks InterState Park | 138 | 1,798 ft | |||
Black Mountain | 48 | 3,005 ft | |||
Mount Mitchell State Park | 9 | 6,258 ft | |||
Linville Falls - Blue Ridge Parkway | None | 3,220 ft | |||
Curtis Creek | 14 | 1,876 ft | |||
Carolina Hemlocks | 38 | 2,750 ft | |||
Watauga Dam Tailwater | 29 | 1,670 ft | |||
Cardens Bluff | 43 | 2,045 ft | |||
Jacobs Creek Rec Area | 51 | 1,832 ft | |||
Patience Park Toe River Campground | 86 | 2,677 ft | |||
Crabtree Meadows - Blue Ridge Parkway | None | 3,751 ft | |||
Roan Mountain State Park | 107 | 2,902 ft | |||
Dennis Cove Rec Area | 20 | 2,594 ft | |||
Lake James State Park | 20 | 1,246 ft | |||
Sugar Hollow City Park | None | 1,837 ft | |||
Little Oak | 72 | 1,741 ft |
Catastrophe Safeguard Index (CSI):
The Catastrophe Safeguard Index (CSI) recognizes that natural disaster risk, encompassing floods, fires, hurricanes, and tornadoes, can drastically affect safety and the overall appeal of an area.
The level of natural disaster risk in a region significantly affects safety and the overall livability, with climate change amplifying these risks by potentially increasing the frequency and intensity of events like floods, fires, hurricanes, and tornadoes, thereby posing substantial challenges to community resilience and well-being.
Community Resilience Indicator (CRI): 1.1
The Community Resilience Indicator (CRI) recognizes that education, healthcare, and socioeconomics are crucial to the well-being of a region. The CRI acknowledges the profound impact of these elements on residents' overall quality of life. By evaluating educational resources, healthcare accessibility, and economic inclusivity, the index captures the essential aspects that contribute to a thriving community, fostering resident satisfaction, equity, and social cohesion.