Flood Watch
2026-11-04T06:00:00-06:00

* WHAT...Flooding caused by excessive rainfall will be possible, especially over the western half of San Luis Valley. * WHERE...The western half of the San Luis Valley, including Del Norte, Antonito and Mogote. * WHEN...From Sunday afternoon through late Tuesday night. * IMPACTS...Excessive runoff may result in flooding of rivers, creeks, streams, and other low-lying and flood-prone location. * ADDITIONAL DETAILS... - Runoff from heavy rain and melting snow over the San Juan Mountains may cause flooding in the San Luis Valley, especially Monday and Tuesday as high flows move out of the mountains and through the Rio Grande and Conejos River. - The greatest risk of flooding will be along the Conejos River and the Rio Grande, including Del Norte and Mogote. - http://www.weather.gov/safety/flood
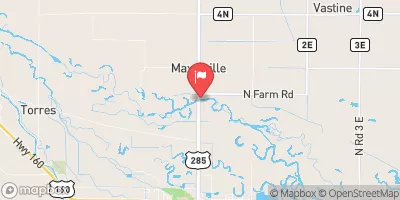
Rio Grande Near Monte Vista, Co. Historical Data

Historical Data


Streamflow Range


Date Average 2026 2025 2024 2023 2022 2021 2020 2019 2018 2017 2016 2015 2014 2013 2012 2011 2010
01-01 370.5
01-02 436.86
01-03 438.92
01-04 431.93
01-05 425.93
01-06 464.31
01-07 433.57
01-08 370.5
01-09 386.43
01-10 405.43
01-11 414.22
01-12 385.57
01-13 404.72
01-14 410.54
01-15 385.5
01-16 373.12
01-17 352.8
01-18 383.87
01-19 370.38
01-20 382.67
01-21 376.67
01-22 371.27
01-23 337.43
01-24 355.07
01-25 355.0
01-26 335.13
01-27 321.6
01-28 331.0
01-29 343.57
01-30 314.0
01-31 358.36
02-01 361.36
02-02 363.71
02-03 330.07
02-04 354.06
02-05 352.71
02-06 361.19
02-07 353.06
02-08 353.71
02-09 356.12
02-10 331.86
02-11 364.24
02-12 334.5
02-13 309.02
02-14 297.25
02-15 274.63
02-16 295.77
02-17 258.67
02-18 237.69
02-19 273.3
02-20 247.77
02-21 234.69
02-22 255.24
02-23 254.71
02-24 227.8
02-25 245.27
02-26 245.3
02-27 242.36
02-28 239.65
02-29 253.0
03-01 236.34
03-02 235.47
03-03 226.32
03-04 219.57
03-05 234.57
03-06 221.44
03-07 213.19
03-08 214.6
03-09 213.57
03-10 218.98
03-11 232.0
03-12 246.07
03-13 269.71
03-14 281.06
03-15 290.25
03-16 295.88
03-17 332.6
03-18 352.38
03-19 373.13
03-20 344.94
03-21 355.25
03-22 367.5
03-23 375.88
03-24 359.47
03-25 359.6
03-26 359.38
03-27 391.6
03-28 390.27
03-29 394.45
03-30 376.59
03-31 376.98
04-01 340.75
04-02 273.48
04-03 220.01
04-04 194.19
04-05 172.1
04-06 163.28
04-07 159.39
04-08 155.61
04-09 156.33
04-10 168.75
04-11 204.68
04-12 226.47
04-13 253.11
04-14 282.42
04-15 281.92
04-16 300.26
04-17 299.43
04-18 319.19
04-19 345.39
04-20 409.85
04-21 396.11
04-22 414.23
04-23 509.14
04-24 438.5
04-25 484.63
04-26 579.26
04-27 510.0
04-28 488.2
04-29 594.4
04-30 605.25
05-01 639.13
05-02 599.21
05-03 696.43
05-04 675.69
05-05 719.63
05-06 843.5
05-07 856.47
05-08 867.57
05-09 831.43
05-10 906.0
05-11 845.8
05-12 810.93
05-13 770.13
05-14 841.71
05-15 950.29
05-16 1105.8
05-17 1200.64
05-18 1152.88
05-19 909.38
05-20 1042.2
05-21 967.13
05-22 1069.44
05-23 1082.14
05-24 1033.38
05-25 989.94
05-26 962.6
05-27 1030.13
05-28 1065.69
05-29 1088.81
05-30 1081.44
05-31 1107.75
06-01 1129.19
06-02 1064.93
06-03 1192.87
06-04 1176.47
06-05 1093.31
06-06 1147.25
06-07 1338.53
06-08 1271.73
06-09 1195.13
06-10 1048.36
06-11 1152.0
06-12 1091.19
06-13 874.6
06-14 1061.93
06-15 985.07
06-16 740.33
06-17 981.33
06-18 933.87
06-19 842.6
06-20 779.88
06-21 811.47
06-22 770.67
06-23 717.93
06-24 705.13
06-25 479.2
06-26 631.13
06-27 392.25
06-28 622.0
06-29 555.41
06-30 558.28
07-01 597.41
07-02 611.21
07-03 552.99
07-04 348.74
07-05 507.02
07-06 504.73
07-07 432.04
07-08 256.03
07-09 418.03
07-10 383.07
07-11 375.12
07-12 350.04
07-13 369.71
07-14 224.61
07-15 318.25
07-16 226.82
07-17 295.77
07-18 265.37
07-19 277.13
07-20 253.59
07-21 212.04
07-22 260.2
07-23 248.69
07-24 224.72
07-25 245.11
07-26 251.04
07-27 239.64
07-28 194.11
07-29 228.24
07-30 250.21
07-31 260.05
08-01 206.55
08-02 281.25
08-03 242.65
08-04 193.47
08-05 265.11
08-06 261.16
08-07 227.0
08-08 236.91
08-09 230.76
08-10 221.66
08-11 153.76
08-12 217.47
08-13 207.8
08-14 143.47
08-15 186.27
08-16 137.75
08-17 141.44
08-18 135.28
08-19 155.55
08-20 157.41
08-21 128.95
08-22 145.84
08-23 162.38
08-24 159.11
08-25 133.91
08-26 160.44
08-27 170.84
08-28 158.01
08-29 140.93
08-30 136.43
08-31 137.21
09-01 119.68
09-02 135.73
09-03 130.99
09-04 129.22
09-05 131.02
09-06 117.36
09-07 128.76
09-08 111.43
09-09 132.59
09-10 131.77
09-11 142.51
09-12 146.56
09-13 148.82
09-14 181.78
09-15 189.01
09-16 193.74
09-17 172.4
09-18 168.33
09-19 221.92
09-20 186.98
09-21 168.42
09-22 171.73
09-23 236.73
09-24 217.13
09-25 190.91
09-26 202.02
09-27 205.82
09-28 207.08
09-29 198.34
09-30 290.31
10-01 276.04
10-02 234.53
10-03 208.85
10-04 186.19
10-05 181.65
10-06 163.56
10-07 154.84
10-08 150.06
10-09 146.93
10-10 151.01
10-11 205.28
10-12 165.34
10-13 251.27
10-14 283.91
10-15 456.55
10-16 290.59
10-17 215.02
10-18 222.34
10-19 207.59
10-20 218.28
10-21 188.79
10-22 177.49
10-23 315.12
10-24 515.11
10-25 407.71
10-26 320.87
10-27 213.75
10-28 148.21
10-29 120.47
10-30 122.0
10-31 100.68
11-01 150.22
11-02 287.79
11-03 271.72
11-04 239.59
11-05 249.29
11-06 239.55
11-07 244.93
11-08 225.27
11-09 234.46
11-10 214.62
11-11 233.7
11-12 201.38
11-13 214.88
11-14 211.76
11-15 226.09
11-16 229.03
11-17 231.4
11-18 230.86
11-19 220.61
11-20 226.85
11-21 243.73
11-22 236.18
11-23 220.15
11-24 226.39
11-25 230.57
11-26 217.0
11-27 211.71
11-28 209.36
11-29 212.93
11-30 210.79
12-01 204.54
12-02 208.21
12-03 207.81
12-04 221.69
12-05 206.43
12-06 202.76
12-07 206.86
12-08 212.83
12-09 240.25
12-10 307.75
12-11 261.08
12-12 229.88
12-13 234.58
12-14 214.5
12-15 214.58
12-16 215.92
12-17 198.17
12-18 222.39
12-19 206.49
12-20 222.16
12-21 255.39
12-22 264.77
12-23 215.73
12-24 202.37
12-25 165.96
12-26 295.84
12-27 375.28
12-28 361.5
12-29 397.03
12-30 359.47
12-31 313.39

Annual Peak Streamflow


Seasonal Comparison


Oceanic Nino Index