

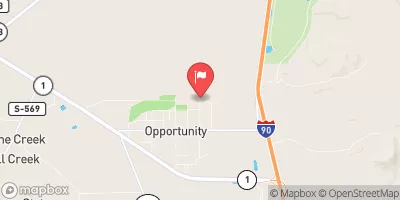
Mill Creek At Opportunity, Mt Realtime Data
MILL CREEK AT OPPORTUNITY, MT
Realtime Data • Report • Conditions
6
Discharge (cfs)
2.4
Gauge Height (ft)
USGS 12323700
Streamflow discharge was last observed at 6 cfs, and a gauge height of 2.42 feet.
With the
% decrease since yesterday,
the streamflow average over the past 10 days is 7 .
Weather today, Tomorrow,
The flow data is provided by the US Geological Survey and is used for managing water resources and flood control. There are no major dams on Mill Creek, but there are several smaller irrigation diversions that can affect the flow. The stream typically has high flows in the spring due to snowmelt and lower flows in the summer and fall. One interesting fact about Mill Creek is that it has been heavily impacted by mining activities in the past, which has left behind legacy contaminants that can affect water quality.
October 22, 2026
| Elevation | 4,938.0 ft |
| Last Updated | |
| Turbidity, water, unfiltered, monochrome near infra-red LED light, 780-900 nm, detection angle 90 ±2.5°, formazin nephelometric units (FNU) | 0.2 FNU |
| Gage height, ft | 2.42 ft |
| Streamflow, ft³/s | 6.02 ft3/s |
| Temperature, water, °C | 7.5 deg C |
| Percent of Normal | 65% |
| Year Over Year Average | 9 cfs |
| 24hr Flow Prediction | cfs |
| Maximum Recorded | 275 cfs |
| Geolocation | 46.11, -112.82 |
 Continue with Snoflo Premium