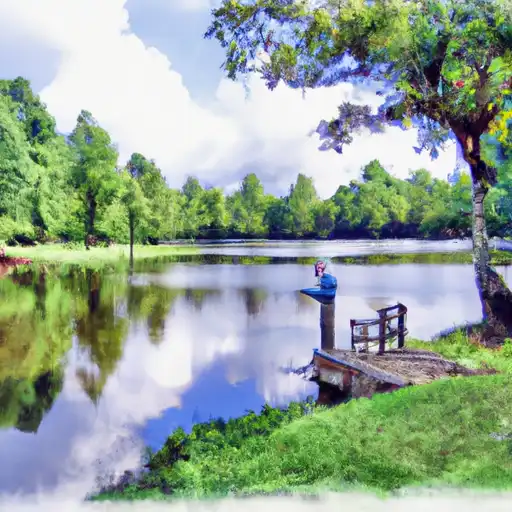
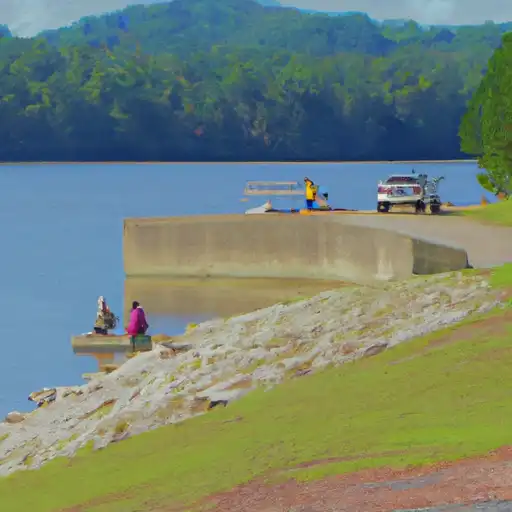
Lake Tuscaloosa Near Tuscaloosa Reservoir
As of July 20, 2026, Lake Tuscaloosa Near Tuscaloosa is holding 223 ft of water — 100% of normal storage for this date. Storage data refreshed throughout the day.

Lake Tuscaloosa Near Tuscaloosa
Lake Tuscaloosa is a man-made reservoir located near Tuscaloosa, Alabama. The lake was created in 1969 by impounding the North River, a tributary of the Black Warrior River. The reservoir was built to serve as a water supply for the city of Tuscaloosa and also provides hydroelectric power. The lake has a surface area of 5,885 acres and a maximum depth of 57 feet. The lake is fed by several creeks and streams, including Brush Creek and Dry Creek. Lake Tuscaloosa is also replenished by snowpack from the Appalachian Mountains. The lake is used for a variety of recreational activities, including fishing, boating, and swimming. The lake is surrounded by homes and is a popular destination for residents and visitors alike. Agricultural activities in the surrounding area also rely on the water supply from Lake Tuscaloosa.
Daily levels at Lake Tuscaloosa Near Tuscaloosa
Storage volume, pool elevation, and total release plotted from the operating agency's daily observations.
Gage height, ft
ft · code 00065
Lake or reservoir water surface elevation above NGVD 1929, ft
ft · code 62614
Precipitation, total, in
in · code 00045
Plan around the weather
Same NOAA / yr.no feed Snoflo's iOS app uses. Watch the precipitation column on the meteogram -- rain on the basin upstream typically lifts inflow 24-72 hours later.
Next 5 days, hour by hour
Temperature line with weather symbols on top, snow + rain accumulation as columns, humidity as a dotted line.
5-day forecast table
Every 3 hours, broken out across temperature, snow, rain, humidity, and wind. Each cell is colour-coded relative to the column min/max.
| Time | Condition | Temp (°F) | Snow (in) | Rain (in) | Humidity (%) | Wind (mps) | Wind dir |
|---|---|---|---|---|---|---|---|
| Loading detailed forecast… | |||||||
15-day temperature & precipitation
Daily temperatures, snow, and rain projected over the next two weeks.
Nearby streamflow gauges
USGS streamgauges around Lake Tuscaloosa Near Tuscaloosa -- inflows here typically show up in storage 24-72 hours later.
| Streamgauge | Discharge | View |
|---|---|---|
| Black Warrior River At Northport Al | 1,960 cfs | → |
| Cribbs Mill Creek At Ww Plant At Tuscaloosa | 10 cfs | → |
| Turkey Creek Near Tuscaloosa | 1 cfs | → |
| Binion Creek Below Gin Creek Near Samantha Al | 13 cfs | → |
| North River Near Samantha Al | 32 cfs | → |
| Sipsey River Nr Elrod | 311 cfs | → |


About Lake Tuscaloosa Near Tuscaloosa
Where does the data for Lake Tuscaloosa Near Tuscaloosa come from?
Daily storage, pool elevation, and release rates are sourced from USGS, USBR, and USACE monitoring stations. Weather forecast comes from NOAA / yr.no -- the same feed Snoflo's iOS app uses.
How often is the report updated?
Storage observations are updated daily by the operating agency. The 15-day weather forecast refreshes throughout the day. Snoflo caches and renders the most recent observation -- check the "as of" timestamp on the storage card.
What does the Hazard hazard rating mean?
The Corps of Engineers' hazard potential classification grades probable consequences if the dam fails: High = probable loss of human life; Significant = no probable loss of human life but possible economic loss / environmental damage; Low = no probable loss of human life, only minor economic / environmental losses. See the Dam Data Reference card below for the full definitions.
What's "% of normal"?
The current storage value compared to the historical average storage on this calendar day. 100% = right on average; values above 100% mean above-normal storage (wet year); values below mean below-normal (dry year or drought).
Can I get alerts when storage crosses a threshold?
Yes -- alerts are managed in the Snoflo iOS app. Favorite this reservoir, set a threshold, and you'll get a push the moment conditions cross.