Gene Wash dam

Gene Wash
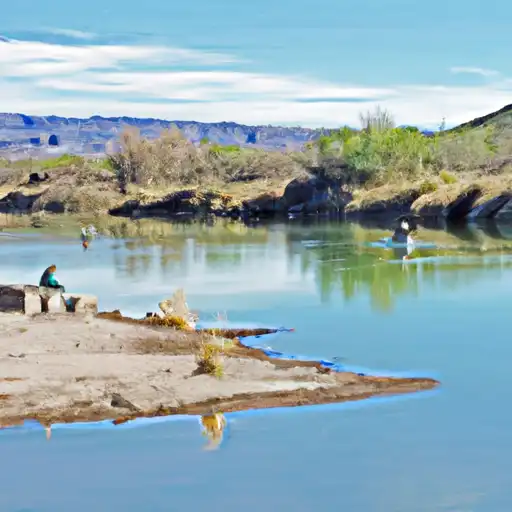
Gene Wash is a remarkable dam located in San Bernardino, California, serving as a vital part of the state's water supply infrastructure. Built in 1937, this arch-type dam stands at a height of 140 feet and has a storage capacity of 6,300 acre-feet. Situated on the Gene Wash river, this structure plays a crucial role in regulating water flow and ensuring a stable water supply for the surrounding areas, especially in times of high demand or drought.
Owned and regulated by the California Department of Water Resources (DWR), Gene Wash is subject to regular inspections and enforcement to maintain its structural integrity and ensure public safety. With a high hazard potential due to its location and purpose, the dam is considered satisfactory in terms of condition assessment. Its emergency action plan is regularly updated and meets guidelines to effectively manage any potential risks or emergencies, demonstrating a commitment to safety and preparedness in the face of changing climate conditions and water resource management challenges.
As part of the larger water management system in California, Gene Wash serves as a critical piece of infrastructure for water supply in the region. With its strategic location and efficient design, this dam plays a key role in supporting the state's water needs and ensuring a reliable source of water for agricultural, industrial, and residential purposes. As climate change continues to impact water resources, structures like Gene Wash will become increasingly important in managing water supply and mitigating the effects of an uncertain future.
Plan around the weather
Same NOAA / yr.no feed Snoflo's iOS app uses. Watch the precipitation column on the meteogram -- rain on the basin upstream typically lifts inflow 24-72 hours later.
Next 5 days, hour by hour
Temperature line with weather symbols on top, snow + rain accumulation as columns, humidity as a dotted line.
5-day forecast table
Every 3 hours, broken out across temperature, snow, rain, humidity, and wind. Each cell is colour-coded relative to the column min/max.
| Time | Condition | Temp (°F) | Snow (in) | Rain (in) | Humidity (%) | Wind (mps) | Wind dir |
|---|---|---|---|---|---|---|---|
| Loading detailed forecast… | |||||||
15-day temperature & precipitation
Daily temperatures, snow, and rain projected over the next two weeks.
Nearby streamflow gauges
USGS streamgauges around Gene Wash -- inflows here typically show up in storage 24-72 hours later.
| Streamgauge | Discharge | View |
|---|---|---|
| Colorado River Below Parker Dam | 2,300 cfs | → |
| Bill Williams River Near Parker | · | → |
| C.R.I.R. Main Canal Nr Parker | 1,250 cfs | → |
| Gardner Lateral Spill Near Parker | 7 cfs | → |
| Poston Wasteway Near Poston | 77 cfs | → |
| Bill Williams River Below Alamo Dam | 34 cfs | → |


About Gene Wash
Where does the data for Gene Wash come from?
Structural and regulatory data come from the U.S. Army Corps of Engineers' National Inventory of Dams (NID). Weather forecast comes from NOAA / yr.no -- the same feed Snoflo's iOS app uses.
How often is the report updated?
NID structural data refreshes annually as the Corps publishes updated assessments. The weather forecast refreshes throughout the day.
What does the High hazard rating mean?
The Corps of Engineers' hazard potential classification grades probable consequences if the dam fails: High = probable loss of human life; Significant = no probable loss of human life but possible economic loss / environmental damage; Low = no probable loss of human life, only minor economic / environmental losses. See the Dam Data Reference card below for the full definitions.
What's "% of normal"?
The current storage value compared to the historical average storage on this calendar day. 100% = right on average; values above 100% mean above-normal storage (wet year); values below mean below-normal (dry year or drought).
Can I get alerts when storage crosses a threshold?
Yes -- alerts are managed in the Snoflo iOS app. Favorite this dam, set a threshold, and you'll get a push the moment conditions cross.
Dam data reference
Condition Assessment
- Satisfactory
- No existing or potential dam safety deficiencies are recognized. Acceptable performance is expected under all loading conditions (static, hydrologic, seismic) in accordance with the minimum applicable state or federal regulatory criteria or tolerable risk guidelines.
- Fair
- No existing dam safety deficiencies are recognized for normal operating conditions. Rare or extreme hydrologic and/or seismic events may result in a dam safety deficiency. Risk may be in the range to take further action.
- Poor
- A dam safety deficiency is recognized for normal operating conditions which may realistically occur. Remedial action is necessary. POOR may also be used when uncertainties exist as to critical analysis parameters which identify a potential dam safety deficiency.
- Unsatisfactory
- A dam safety deficiency is recognized that requires immediate or emergency remedial action for problem resolution.
- Not Rated
- The dam has not been inspected, is not under state or federal jurisdiction, or has been inspected but, for whatever reason, has not been rated.
Hazard Potential Classification
- High
- Dams assigned the high hazard potential classification are those where failure or mis-operation will probably cause loss of human life.
- Significant
- Dams assigned the significant hazard potential classification are those dams where failure or mis-operation results in no probable loss of human life but can cause economic loss, environmental damage, disruption of lifeline facilities, or impact other concerns. Significant hazard potential classification dams are often located in predominantly rural or agricultural areas but could be in areas with population and significant infrastructure.
- Low
- Dams assigned the low hazard potential classification are those where failure or mis-operation results in no probable loss of human life and low economic and/or environmental losses. Losses are principally limited to the owner's property.
- Undetermined
- Dams for which a downstream hazard potential has not been designated or is not provided.