Salt Springs Valley Dam

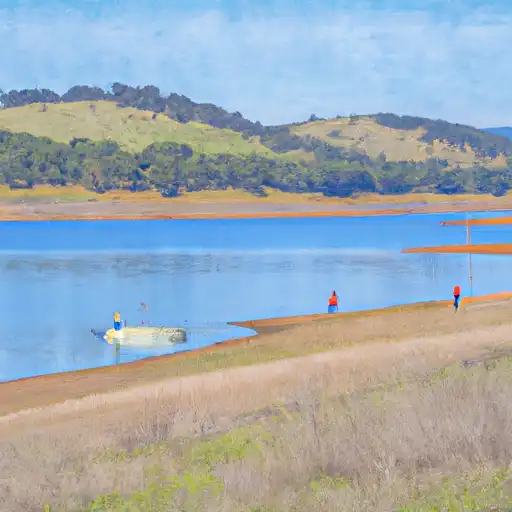
Salt Springs Valley
Salt Springs Valley in Calaveras County, California, is home to a significant earth dam completed in 1882 for flood risk reduction along Rock Creek. With a height of 47 feet and a storage capacity of 10,900 acre-feet, the dam serves multiple purposes including irrigation, tailings management, and water supply. The dam's condition is assessed as fair, with a significant hazard potential, requiring regular inspections and enforcement by the California Department of Water Resources.
Located in the city of Milton, Salt Springs Valley Dam plays a crucial role in managing water resources in the region, with a drainage area of 20.03 square miles and a surface area of 920 acres. Despite its age, the dam continues to meet state regulatory requirements for permitting, inspection, and enforcement. The dam's primary owner, a public utility, ensures that it remains in operational condition to mitigate flood risks and support the local agricultural community.
With a spillway width and other structural details not specified in the data, the dam's design and construction reflect the engineering practices of the late 19th century. As climate change impacts water resources in California, Salt Springs Valley Dam stands as a historical landmark and a critical infrastructure for flood protection and water management in the region. Enthusiasts of water resources and climate resilience can appreciate the unique role that this earth dam plays in sustaining the ecological balance and agricultural livelihoods in the Salt Springs Valley area.
Plan around the weather
Same NOAA / yr.no feed Snoflo's iOS app uses. Watch the precipitation column on the meteogram -- rain on the basin upstream typically lifts inflow 24-72 hours later.
Next 5 days, hour by hour
Temperature line with weather symbols on top, snow + rain accumulation as columns, humidity as a dotted line.
5-day forecast table
Every 3 hours, broken out across temperature, snow, rain, humidity, and wind. Each cell is colour-coded relative to the column min/max.
| Time | Condition | Temp (°F) | Snow (in) | Rain (in) | Humidity (%) | Wind (mps) | Wind dir |
|---|---|---|---|---|---|---|---|
| Loading detailed forecast… | |||||||
15-day temperature & precipitation
Daily temperatures, snow, and rain projected over the next two weeks.
Nearby streamflow gauges
USGS streamgauges around Salt Springs Valley -- inflows here typically show up in storage 24-72 hours later.
| Streamgauge | Discharge | View |
|---|---|---|
| Black C Nr Copperopolis Ca | · | → |
| Stanislaus R A Ripon Ca | 231 cfs | → |
| Modesto Cn Nr La Grange Ca | 1,220 cfs | → |
| Tuolumne R A Modesto Ca | 170 cfs | → |
| Tuolumne R Bl Lagrange Dam Nr Lagrange Ca | 330 cfs | → |
| Turlock Cn Nr La Grange Ca | 2,050 cfs | → |


About Salt Springs Valley
Where does the data for Salt Springs Valley come from?
Structural and regulatory data come from the U.S. Army Corps of Engineers' National Inventory of Dams (NID). Weather forecast comes from NOAA / yr.no -- the same feed Snoflo's iOS app uses.
How often is the report updated?
NID structural data refreshes annually as the Corps publishes updated assessments. The weather forecast refreshes throughout the day.
What does the Significant hazard rating mean?
The Corps of Engineers' hazard potential classification grades probable consequences if the dam fails: High = probable loss of human life; Significant = no probable loss of human life but possible economic loss / environmental damage; Low = no probable loss of human life, only minor economic / environmental losses. See the Dam Data Reference card below for the full definitions.
What's "% of normal"?
The current storage value compared to the historical average storage on this calendar day. 100% = right on average; values above 100% mean above-normal storage (wet year); values below mean below-normal (dry year or drought).
Can I get alerts when storage crosses a threshold?
Yes -- alerts are managed in the Snoflo iOS app. Favorite this dam, set a threshold, and you'll get a push the moment conditions cross.
Dam data reference
Condition Assessment
- Satisfactory
- No existing or potential dam safety deficiencies are recognized. Acceptable performance is expected under all loading conditions (static, hydrologic, seismic) in accordance with the minimum applicable state or federal regulatory criteria or tolerable risk guidelines.
- Fair
- No existing dam safety deficiencies are recognized for normal operating conditions. Rare or extreme hydrologic and/or seismic events may result in a dam safety deficiency. Risk may be in the range to take further action.
- Poor
- A dam safety deficiency is recognized for normal operating conditions which may realistically occur. Remedial action is necessary. POOR may also be used when uncertainties exist as to critical analysis parameters which identify a potential dam safety deficiency.
- Unsatisfactory
- A dam safety deficiency is recognized that requires immediate or emergency remedial action for problem resolution.
- Not Rated
- The dam has not been inspected, is not under state or federal jurisdiction, or has been inspected but, for whatever reason, has not been rated.
Hazard Potential Classification
- High
- Dams assigned the high hazard potential classification are those where failure or mis-operation will probably cause loss of human life.
- Significant
- Dams assigned the significant hazard potential classification are those dams where failure or mis-operation results in no probable loss of human life but can cause economic loss, environmental damage, disruption of lifeline facilities, or impact other concerns. Significant hazard potential classification dams are often located in predominantly rural or agricultural areas but could be in areas with population and significant infrastructure.
- Low
- Dams assigned the low hazard potential classification are those where failure or mis-operation results in no probable loss of human life and low economic and/or environmental losses. Losses are principally limited to the owner's property.
- Undetermined
- Dams for which a downstream hazard potential has not been designated or is not provided.