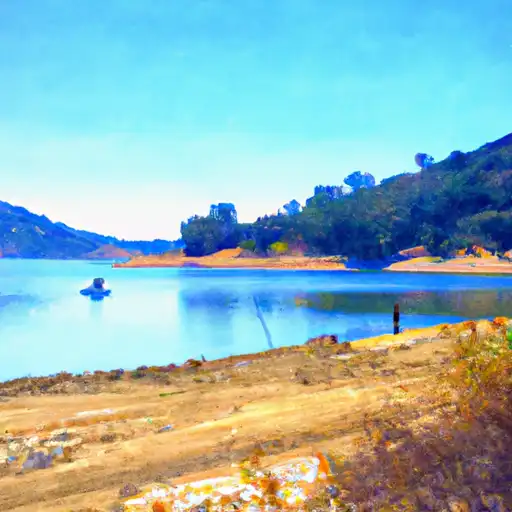
Upper Sand Creek Detention Basin dam

Upper Sand Creek Detention Basin
The Upper Sand Creek Detention Basin in Contra Costa, California, is a crucial flood risk reduction infrastructure completed in 2014. This earth dam stands at a height of 40 feet and has a maximum storage capacity of 895 acre-feet, serving its primary purpose effectively. The basin covers a surface area of 44 acres and plays a vital role in managing the flow of the Sand Creek river, safeguarding the surrounding areas from potential flooding events.
Managed by the local government and regulated by the Department of Water Resources (DWR), Safety of Dams division, the Upper Sand Creek Detention Basin is inspected regularly to ensure its structural integrity and safety. With a high hazard potential but a satisfactory condition assessment as of September 2017, the basin remains a critical asset in the region's water resource management strategy. Despite lacking detailed risk management measures and emergency preparedness plans, the basin's presence aligns with the state's commitment to mitigating flood risks and protecting communities in California.
Supported by federal and state regulations, the Upper Sand Creek Detention Basin stands as a testament to proactive flood risk reduction efforts in the region. With a dedicated focus on safety and efficiency, this infrastructure project highlights the importance of sustainable water resource management in the face of changing climate patterns. As water resource and climate enthusiasts, the basin serves as a symbol of resilience and preparedness in safeguarding communities against the impacts of extreme weather events.
Plan around the weather
Same NOAA / yr.no feed Snoflo's iOS app uses. Watch the precipitation column on the meteogram -- rain on the basin upstream typically lifts inflow 24-72 hours later.
Next 5 days, hour by hour
Temperature line with weather symbols on top, snow + rain accumulation as columns, humidity as a dotted line.
5-day forecast table
Every 3 hours, broken out across temperature, snow, rain, humidity, and wind. Each cell is colour-coded relative to the column min/max.
| Time | Condition | Temp (°F) | Snow (in) | Rain (in) | Humidity (%) | Wind (mps) | Wind dir |
|---|---|---|---|---|---|---|---|
| Loading detailed forecast… | |||||||
15-day temperature & precipitation
Daily temperatures, snow, and rain projected over the next two weeks.
Nearby streamflow gauges
USGS streamgauges around Upper Sand Creek Detention Basin -- inflows here typically show up in storage 24-72 hours later.
| Streamgauge | Discharge | View |
|---|---|---|
| Marsh C A Brentwood Ca | 0 cfs | → |
| Dutch Slough Bl Jersey Island Rd A Jersey Island | 384 cfs | → |
| San Joaquin R A Jersey Point Ca | 845 cfs | → |
| False R Nr Oakley Ca | 13,000 cfs | → |
| Old R A Bacon Island Ca | 6,370 cfs | → |
| Threemile Slough Nr Rio Vista Ca | 1,860 cfs | → |


About Upper Sand Creek Detention Basin
Where does the data for Upper Sand Creek Detention Basin come from?
Structural and regulatory data come from the U.S. Army Corps of Engineers' National Inventory of Dams (NID). Weather forecast comes from NOAA / yr.no -- the same feed Snoflo's iOS app uses.
How often is the report updated?
NID structural data refreshes annually as the Corps publishes updated assessments. The weather forecast refreshes throughout the day.
What does the High hazard rating mean?
The Corps of Engineers' hazard potential classification grades probable consequences if the dam fails: High = probable loss of human life; Significant = no probable loss of human life but possible economic loss / environmental damage; Low = no probable loss of human life, only minor economic / environmental losses. See the Dam Data Reference card below for the full definitions.
What's "% of normal"?
The current storage value compared to the historical average storage on this calendar day. 100% = right on average; values above 100% mean above-normal storage (wet year); values below mean below-normal (dry year or drought).
Can I get alerts when storage crosses a threshold?
Yes -- alerts are managed in the Snoflo iOS app. Favorite this dam, set a threshold, and you'll get a push the moment conditions cross.
Dam data reference
Condition Assessment
- Satisfactory
- No existing or potential dam safety deficiencies are recognized. Acceptable performance is expected under all loading conditions (static, hydrologic, seismic) in accordance with the minimum applicable state or federal regulatory criteria or tolerable risk guidelines.
- Fair
- No existing dam safety deficiencies are recognized for normal operating conditions. Rare or extreme hydrologic and/or seismic events may result in a dam safety deficiency. Risk may be in the range to take further action.
- Poor
- A dam safety deficiency is recognized for normal operating conditions which may realistically occur. Remedial action is necessary. POOR may also be used when uncertainties exist as to critical analysis parameters which identify a potential dam safety deficiency.
- Unsatisfactory
- A dam safety deficiency is recognized that requires immediate or emergency remedial action for problem resolution.
- Not Rated
- The dam has not been inspected, is not under state or federal jurisdiction, or has been inspected but, for whatever reason, has not been rated.
Hazard Potential Classification
- High
- Dams assigned the high hazard potential classification are those where failure or mis-operation will probably cause loss of human life.
- Significant
- Dams assigned the significant hazard potential classification are those dams where failure or mis-operation results in no probable loss of human life but can cause economic loss, environmental damage, disruption of lifeline facilities, or impact other concerns. Significant hazard potential classification dams are often located in predominantly rural or agricultural areas but could be in areas with population and significant infrastructure.
- Low
- Dams assigned the low hazard potential classification are those where failure or mis-operation results in no probable loss of human life and low economic and/or environmental losses. Losses are principally limited to the owner's property.
- Undetermined
- Dams for which a downstream hazard potential has not been designated or is not provided.