Jim Britton Lake Dam Dam

Jim Britton Lake Dam
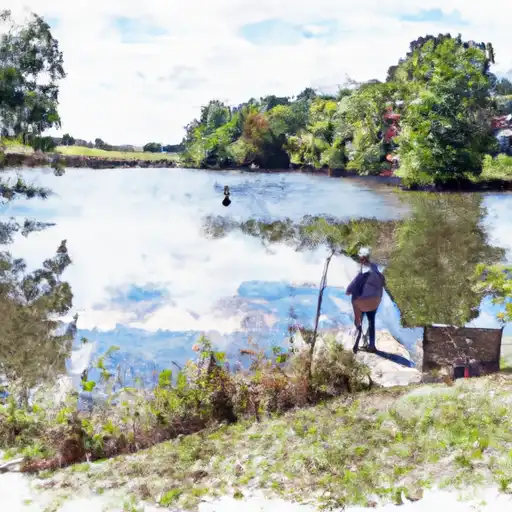
Jim Britton Lake Dam in Dearborn, Indiana, stands as a private-owned structure primarily serving the purpose of recreation. This earthen dam reaches 50 feet in height and spans a length of 400 feet, with a storage capacity of 375 acre-feet. The dam, situated in a picturesque location with a surface area of 15 acres, offers a tranquil retreat for water resource and climate enthusiasts seeking outdoor leisure activities.
Despite being unregulated by the state, Jim Britton Lake Dam's hazard potential remains undetermined, with its condition yet to be rated. The last inspection conducted in 1970 revealed a lack of recent assessments, highlighting the need for updated evaluations to ensure the safety and effectiveness of the structure. With its location in a scenic county in Indiana, the dam presents an opportunity for further exploration and research in the realm of water resource management and climate impact assessment.
As a vital component of the local landscape, Jim Britton Lake Dam serves as a focal point for understanding the intersection of water resources, climate dynamics, and recreational activities. With its peaceful surroundings and potential for future development, this dam offers a unique opportunity for enthusiasts to engage with the complexities of water infrastructure while appreciating the natural beauty of its location. As efforts continue to assess and enhance the structure's safety and performance, there is a growing need for collaboration and research in harnessing the full potential of this reservoir for both recreational and environmental purposes.
Plan around the weather
Same NOAA / yr.no feed Snoflo's iOS app uses. Watch the precipitation column on the meteogram -- rain on the basin upstream typically lifts inflow 24-72 hours later.
Next 5 days, hour by hour
Temperature line with weather symbols on top, snow + rain accumulation as columns, humidity as a dotted line.
5-day forecast table
Every 3 hours, broken out across temperature, snow, rain, humidity, and wind. Each cell is colour-coded relative to the column min/max.
| Time | Condition | Temp (°F) | Snow (in) | Rain (in) | Humidity (%) | Wind (mps) | Wind dir |
|---|---|---|---|---|---|---|---|
| Loading detailed forecast… | |||||||
15-day temperature & precipitation
Daily temperatures, snow, and rain projected over the next two weeks.
Nearby streamflow gauges
USGS streamgauges around Jim Britton Lake Dam -- inflows here typically show up in storage 24-72 hours later.
| Streamgauge | Discharge | View |
|---|---|---|
| Woolper Creek At Woolper Road Near Burlington | 17 cfs | → |
| Elijahs Creek @ Elijahs Creek Rd Nr Hebron | 41 cfs | → |
| Gunpowder Cr At Camp Ernst Rd Nr Union | 398 cfs | → |
| Whitewater River At Brookville | 662 cfs | → |
| Banklick Creek @ Highway 1829 Nr Erlanger | 196 cfs | → |
| Mill Creek At Carthage Oh | 36 cfs | → |


About Jim Britton Lake Dam
Where does the data for Jim Britton Lake Dam come from?
Structural and regulatory data come from the U.S. Army Corps of Engineers' National Inventory of Dams (NID). Weather forecast comes from NOAA / yr.no -- the same feed Snoflo's iOS app uses.
How often is the report updated?
NID structural data refreshes annually as the Corps publishes updated assessments. The weather forecast refreshes throughout the day.
What does the Undetermined hazard rating mean?
The Corps of Engineers' hazard potential classification grades probable consequences if the dam fails: High = probable loss of human life; Significant = no probable loss of human life but possible economic loss / environmental damage; Low = no probable loss of human life, only minor economic / environmental losses. See the Dam Data Reference card below for the full definitions.
What's "% of normal"?
The current storage value compared to the historical average storage on this calendar day. 100% = right on average; values above 100% mean above-normal storage (wet year); values below mean below-normal (dry year or drought).
Can I get alerts when storage crosses a threshold?
Yes -- alerts are managed in the Snoflo iOS app. Favorite this dam, set a threshold, and you'll get a push the moment conditions cross.
Dam data reference
Condition Assessment
- Satisfactory
- No existing or potential dam safety deficiencies are recognized. Acceptable performance is expected under all loading conditions (static, hydrologic, seismic) in accordance with the minimum applicable state or federal regulatory criteria or tolerable risk guidelines.
- Fair
- No existing dam safety deficiencies are recognized for normal operating conditions. Rare or extreme hydrologic and/or seismic events may result in a dam safety deficiency. Risk may be in the range to take further action.
- Poor
- A dam safety deficiency is recognized for normal operating conditions which may realistically occur. Remedial action is necessary. POOR may also be used when uncertainties exist as to critical analysis parameters which identify a potential dam safety deficiency.
- Unsatisfactory
- A dam safety deficiency is recognized that requires immediate or emergency remedial action for problem resolution.
- Not Rated
- The dam has not been inspected, is not under state or federal jurisdiction, or has been inspected but, for whatever reason, has not been rated.
Hazard Potential Classification
- High
- Dams assigned the high hazard potential classification are those where failure or mis-operation will probably cause loss of human life.
- Significant
- Dams assigned the significant hazard potential classification are those dams where failure or mis-operation results in no probable loss of human life but can cause economic loss, environmental damage, disruption of lifeline facilities, or impact other concerns. Significant hazard potential classification dams are often located in predominantly rural or agricultural areas but could be in areas with population and significant infrastructure.
- Low
- Dams assigned the low hazard potential classification are those where failure or mis-operation results in no probable loss of human life and low economic and/or environmental losses. Losses are principally limited to the owner's property.
- Undetermined
- Dams for which a downstream hazard potential has not been designated or is not provided.