Robert Alford Dam

Robert Alford Dam
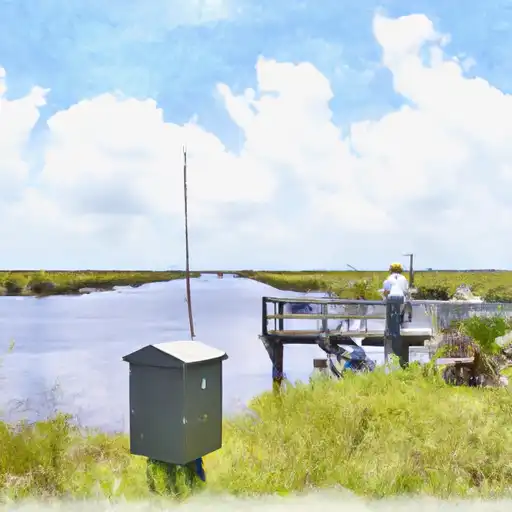
Located in East Feliciana, Louisiana, the Robert Alford Dam stands as a testament to both engineering prowess and environmental stewardship. Completed in 1985, this private-owned earth dam spans 930 feet in length and reaches a height of 14 feet, holding a maximum storage capacity of 887 acre-feet. Situated on Hurrican Creek, the dam primarily serves recreational purposes, offering a tranquil retreat for water resource and climate enthusiasts to enjoy the natural beauty of the surrounding area.
Managed by the Louisiana Department of Transportation and Development, the dam boasts a low hazard potential and fair condition assessment, ensuring the safety of the local community and ecosystem. Despite its modest size, the Robert Alford Dam plays a crucial role in mitigating flood risks and promoting water conservation efforts in the region. With a risk assessment rating of moderate, ongoing monitoring and maintenance are key priorities to uphold the dam's structural integrity and safeguard its surrounding environment.
As a focal point for outdoor recreation and water resource management, the Robert Alford Dam exemplifies the harmonious coexistence of human infrastructure and natural landscapes. From its uncontrolled spillway to the soil foundations that support it, every aspect of the dam reflects a commitment to sustainable development and responsible stewardship of water resources. For those passionate about climate resilience and environmental conservation, the Robert Alford Dam stands as a shining example of how infrastructure can enhance, rather than detract from, the natural world.
Plan around the weather
Same NOAA / yr.no feed Snoflo's iOS app uses. Watch the precipitation column on the meteogram -- rain on the basin upstream typically lifts inflow 24-72 hours later.
Next 5 days, hour by hour
Temperature line with weather symbols on top, snow + rain accumulation as columns, humidity as a dotted line.
5-day forecast table
Every 3 hours, broken out across temperature, snow, rain, humidity, and wind. Each cell is colour-coded relative to the column min/max.
| Time | Condition | Temp (°F) | Snow (in) | Rain (in) | Humidity (%) | Wind (mps) | Wind dir |
|---|---|---|---|---|---|---|---|
| Loading detailed forecast… | |||||||
15-day temperature & precipitation
Daily temperatures, snow, and rain projected over the next two weeks.
Nearby streamflow gauges
USGS streamgauges around Robert Alford Dam -- inflows here typically show up in storage 24-72 hours later.
| Streamgauge | Discharge | View |
|---|---|---|
| Comite River Near Olive Branch | 65 cfs | → |
| Buffalo River Nr Woodville | 63 cfs | → |
| Amite River Near Darlington | 496 cfs | → |
| Homochitto River At Rosetta | 379 cfs | → |
| Tickfaw River At Liverpool | 58 cfs | → |
| Comite River Near Comite | 155 cfs | → |


About Robert Alford Dam
Where does the data for Robert Alford Dam come from?
Structural and regulatory data come from the U.S. Army Corps of Engineers' National Inventory of Dams (NID). Weather forecast comes from NOAA / yr.no -- the same feed Snoflo's iOS app uses.
How often is the report updated?
NID structural data refreshes annually as the Corps publishes updated assessments. The weather forecast refreshes throughout the day.
What does the Low hazard rating mean?
The Corps of Engineers' hazard potential classification grades probable consequences if the dam fails: High = probable loss of human life; Significant = no probable loss of human life but possible economic loss / environmental damage; Low = no probable loss of human life, only minor economic / environmental losses. See the Dam Data Reference card below for the full definitions.
What's "% of normal"?
The current storage value compared to the historical average storage on this calendar day. 100% = right on average; values above 100% mean above-normal storage (wet year); values below mean below-normal (dry year or drought).
Can I get alerts when storage crosses a threshold?
Yes -- alerts are managed in the Snoflo iOS app. Favorite this dam, set a threshold, and you'll get a push the moment conditions cross.
Dam data reference
Condition Assessment
- Satisfactory
- No existing or potential dam safety deficiencies are recognized. Acceptable performance is expected under all loading conditions (static, hydrologic, seismic) in accordance with the minimum applicable state or federal regulatory criteria or tolerable risk guidelines.
- Fair
- No existing dam safety deficiencies are recognized for normal operating conditions. Rare or extreme hydrologic and/or seismic events may result in a dam safety deficiency. Risk may be in the range to take further action.
- Poor
- A dam safety deficiency is recognized for normal operating conditions which may realistically occur. Remedial action is necessary. POOR may also be used when uncertainties exist as to critical analysis parameters which identify a potential dam safety deficiency.
- Unsatisfactory
- A dam safety deficiency is recognized that requires immediate or emergency remedial action for problem resolution.
- Not Rated
- The dam has not been inspected, is not under state or federal jurisdiction, or has been inspected but, for whatever reason, has not been rated.
Hazard Potential Classification
- High
- Dams assigned the high hazard potential classification are those where failure or mis-operation will probably cause loss of human life.
- Significant
- Dams assigned the significant hazard potential classification are those dams where failure or mis-operation results in no probable loss of human life but can cause economic loss, environmental damage, disruption of lifeline facilities, or impact other concerns. Significant hazard potential classification dams are often located in predominantly rural or agricultural areas but could be in areas with population and significant infrastructure.
- Low
- Dams assigned the low hazard potential classification are those where failure or mis-operation results in no probable loss of human life and low economic and/or environmental losses. Losses are principally limited to the owner's property.
- Undetermined
- Dams for which a downstream hazard potential has not been designated or is not provided.