Klondike Lake Dam Dam

Klondike Lake Dam
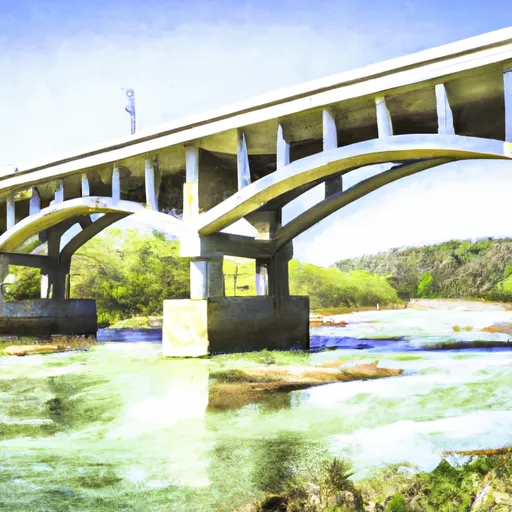
Located in St. Charles, Missouri, Klondike Lake Dam stands as a testament to human ingenuity and engineering prowess. Completed in 1965, this private-owned earth-type dam primarily serves the purpose of recreation, offering a serene oasis for water resource and climate enthusiasts to enjoy. With a structural height of 50 feet and a length of 720 feet, this impressive structure boasts a storage capacity of 292 acre-feet and covers a surface area of 19 acres.
The dam's low hazard potential and satisfactory condition assessment make it a safe and reliable water management infrastructure. Managed by the DAM AND RESERVOIR SAFETY PROG in Missouri, Klondike Lake Dam is equipped with an uncontrolled spillway with a width of 66 feet to handle maximum discharge of 465 cubic feet per second. Despite its moderate risk assessment, the dam has undergone regular inspections, with the last one conducted in March 2015, ensuring its operational integrity and safety for both the environment and nearby communities.
For water resource and climate enthusiasts, Klondike Lake Dam offers a fascinating glimpse into the intersection of human innovation and environmental stewardship. Its strategic location in the TRIB MISSOURI RIVER watershed, along with its recreational focus and commitment to safety and regulatory compliance, make it a noteworthy landmark in the region. As water management continues to be a critical issue in the face of climate change, Klondike Lake Dam stands as a beacon of responsible infrastructure development and sustainable resource utilization.
Plan around the weather
Same NOAA / yr.no feed Snoflo's iOS app uses. Watch the precipitation column on the meteogram -- rain on the basin upstream typically lifts inflow 24-72 hours later.
Next 5 days, hour by hour
Temperature line with weather symbols on top, snow + rain accumulation as columns, humidity as a dotted line.
5-day forecast table
Every 3 hours, broken out across temperature, snow, rain, humidity, and wind. Each cell is colour-coded relative to the column min/max.
| Time | Condition | Temp (°F) | Snow (in) | Rain (in) | Humidity (%) | Wind (mps) | Wind dir |
|---|---|---|---|---|---|---|---|
| Loading detailed forecast… | |||||||
15-day temperature & precipitation
Daily temperatures, snow, and rain projected over the next two weeks.
Nearby streamflow gauges
USGS streamgauges around Klondike Lake Dam -- inflows here typically show up in storage 24-72 hours later.
| Streamgauge | Discharge | View |
|---|---|---|
| Bonhomme Creek Near Ellisville | 0 cfs | → |
| Meramec River At Pacific | 2,370 cfs | → |
| Bourbeuse River At Union | 323 cfs | → |
| Bonhomme Creek Near Clarkson Valley | 7 cfs | → |
| Dardenne Creek At Ofallon | 4 cfs | → |
| Caulks Creek At Chesterfield | 20 cfs | → |


About Klondike Lake Dam
Where does the data for Klondike Lake Dam come from?
Structural and regulatory data come from the U.S. Army Corps of Engineers' National Inventory of Dams (NID). Weather forecast comes from NOAA / yr.no -- the same feed Snoflo's iOS app uses.
How often is the report updated?
NID structural data refreshes annually as the Corps publishes updated assessments. The weather forecast refreshes throughout the day.
What does the Low hazard rating mean?
The Corps of Engineers' hazard potential classification grades probable consequences if the dam fails: High = probable loss of human life; Significant = no probable loss of human life but possible economic loss / environmental damage; Low = no probable loss of human life, only minor economic / environmental losses. See the Dam Data Reference card below for the full definitions.
What's "% of normal"?
The current storage value compared to the historical average storage on this calendar day. 100% = right on average; values above 100% mean above-normal storage (wet year); values below mean below-normal (dry year or drought).
Can I get alerts when storage crosses a threshold?
Yes -- alerts are managed in the Snoflo iOS app. Favorite this dam, set a threshold, and you'll get a push the moment conditions cross.
Dam data reference
Condition Assessment
- Satisfactory
- No existing or potential dam safety deficiencies are recognized. Acceptable performance is expected under all loading conditions (static, hydrologic, seismic) in accordance with the minimum applicable state or federal regulatory criteria or tolerable risk guidelines.
- Fair
- No existing dam safety deficiencies are recognized for normal operating conditions. Rare or extreme hydrologic and/or seismic events may result in a dam safety deficiency. Risk may be in the range to take further action.
- Poor
- A dam safety deficiency is recognized for normal operating conditions which may realistically occur. Remedial action is necessary. POOR may also be used when uncertainties exist as to critical analysis parameters which identify a potential dam safety deficiency.
- Unsatisfactory
- A dam safety deficiency is recognized that requires immediate or emergency remedial action for problem resolution.
- Not Rated
- The dam has not been inspected, is not under state or federal jurisdiction, or has been inspected but, for whatever reason, has not been rated.
Hazard Potential Classification
- High
- Dams assigned the high hazard potential classification are those where failure or mis-operation will probably cause loss of human life.
- Significant
- Dams assigned the significant hazard potential classification are those dams where failure or mis-operation results in no probable loss of human life but can cause economic loss, environmental damage, disruption of lifeline facilities, or impact other concerns. Significant hazard potential classification dams are often located in predominantly rural or agricultural areas but could be in areas with population and significant infrastructure.
- Low
- Dams assigned the low hazard potential classification are those where failure or mis-operation results in no probable loss of human life and low economic and/or environmental losses. Losses are principally limited to the owner's property.
- Undetermined
- Dams for which a downstream hazard potential has not been designated or is not provided.