Hinckley dam

Hinckley
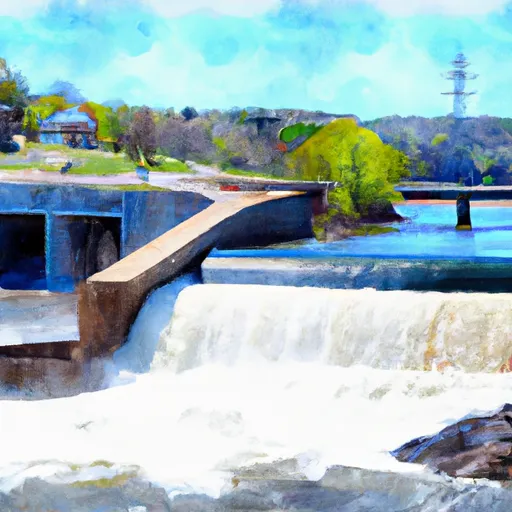
Hinckley Dam, located in Herkimer, New York, is a significant hydroelectric structure built in 1914 by the New York State Dept. of Public Works/DOT. The dam, with a height of 83 feet and a length of 3635 feet, serves multiple purposes including hydroelectric power generation, navigation, and water supply. The dam has a storage capacity of 76,200 acre-feet and controls the flow of the West Canada Creek, with a maximum discharge of 106,695 cubic feet per second.
Managed by the Federal Energy Regulatory Commission, Hinckley Dam has a high hazard potential and a moderate risk assessment rating. Although the dam's condition assessment is not available, regular inspections are conducted. The dam's spillway, with a width of 400 feet, is uncontrolled, presenting a potential risk in case of high water flow. Despite being located in a state regulated area, the dam does not require state permitting but undergoes regular state inspections.
Overall, Hinckley Dam stands as a vital infrastructure for water resource management in the region, providing clean energy through hydroelectric power generation and ensuring a stable water supply for various purposes. With its historical significance and multifaceted contributions, Hinckley Dam remains a key player in the sustainable utilization of water resources and combating the challenges posed by climate change.
Plan around the weather
Same NOAA / yr.no feed Snoflo's iOS app uses. Watch the precipitation column on the meteogram -- rain on the basin upstream typically lifts inflow 24-72 hours later.
Next 5 days, hour by hour
Temperature line with weather symbols on top, snow + rain accumulation as columns, humidity as a dotted line.
5-day forecast table
Every 3 hours, broken out across temperature, snow, rain, humidity, and wind. Each cell is colour-coded relative to the column min/max.
| Time | Condition | Temp (°F) | Snow (in) | Rain (in) | Humidity (%) | Wind (mps) | Wind dir |
|---|---|---|---|---|---|---|---|
| Loading detailed forecast… | |||||||
15-day temperature & precipitation
Daily temperatures, snow, and rain projected over the next two weeks.
Nearby streamflow gauges
USGS streamgauges around Hinckley -- inflows here typically show up in storage 24-72 hours later.
| Streamgauge | Discharge | View |
|---|---|---|
| West Canada Creek Near Wilmurt Ny | 54 cfs | → |
| Mohawk River Below Delta Dam Near Rome Ny | 159 cfs | → |
| Black River Near Boonville Ny | 176 cfs | → |
| West Canada Creek At Kast Bridge Ny | 973 cfs | → |
| Steele Cr At Ilion Ny | 9 cfs | → |
| East Branch Fish Creek At Taberg Ny | 499 cfs | → |


About Hinckley
Where does the data for Hinckley come from?
Structural and regulatory data come from the U.S. Army Corps of Engineers' National Inventory of Dams (NID). Weather forecast comes from NOAA / yr.no -- the same feed Snoflo's iOS app uses.
How often is the report updated?
NID structural data refreshes annually as the Corps publishes updated assessments. The weather forecast refreshes throughout the day.
What does the High hazard rating mean?
The Corps of Engineers' hazard potential classification grades probable consequences if the dam fails: High = probable loss of human life; Significant = no probable loss of human life but possible economic loss / environmental damage; Low = no probable loss of human life, only minor economic / environmental losses. See the Dam Data Reference card below for the full definitions.
What's "% of normal"?
The current storage value compared to the historical average storage on this calendar day. 100% = right on average; values above 100% mean above-normal storage (wet year); values below mean below-normal (dry year or drought).
Can I get alerts when storage crosses a threshold?
Yes -- alerts are managed in the Snoflo iOS app. Favorite this dam, set a threshold, and you'll get a push the moment conditions cross.
Dam data reference
Condition Assessment
- Satisfactory
- No existing or potential dam safety deficiencies are recognized. Acceptable performance is expected under all loading conditions (static, hydrologic, seismic) in accordance with the minimum applicable state or federal regulatory criteria or tolerable risk guidelines.
- Fair
- No existing dam safety deficiencies are recognized for normal operating conditions. Rare or extreme hydrologic and/or seismic events may result in a dam safety deficiency. Risk may be in the range to take further action.
- Poor
- A dam safety deficiency is recognized for normal operating conditions which may realistically occur. Remedial action is necessary. POOR may also be used when uncertainties exist as to critical analysis parameters which identify a potential dam safety deficiency.
- Unsatisfactory
- A dam safety deficiency is recognized that requires immediate or emergency remedial action for problem resolution.
- Not Rated
- The dam has not been inspected, is not under state or federal jurisdiction, or has been inspected but, for whatever reason, has not been rated.
Hazard Potential Classification
- High
- Dams assigned the high hazard potential classification are those where failure or mis-operation will probably cause loss of human life.
- Significant
- Dams assigned the significant hazard potential classification are those dams where failure or mis-operation results in no probable loss of human life but can cause economic loss, environmental damage, disruption of lifeline facilities, or impact other concerns. Significant hazard potential classification dams are often located in predominantly rural or agricultural areas but could be in areas with population and significant infrastructure.
- Low
- Dams assigned the low hazard potential classification are those where failure or mis-operation results in no probable loss of human life and low economic and/or environmental losses. Losses are principally limited to the owner's property.
- Undetermined
- Dams for which a downstream hazard potential has not been designated or is not provided.