Cinnamon Lake Dam Dam

Cinnamon Lake Dam
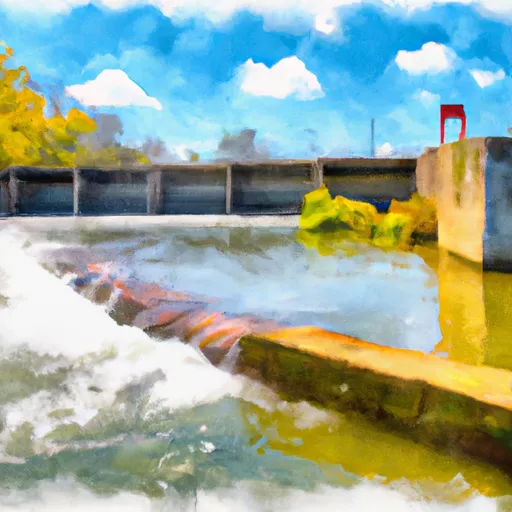
Cinnamon Lake Dam, located in Ashland, Ohio, is a privately owned structure that serves primarily for recreation purposes. Built in 1970, this earth dam stands at a height of 45 feet and spans 3075 feet in length. With a maximum storage capacity of 3577 acre-feet and a normal storage of 1480 acre-feet, the dam sits on the Muddy Fork river and covers a surface area of 161 acres.
Managed by the Department of Natural Resources in Ohio, Cinnamon Lake Dam has a high hazard potential and is classified as being in fair condition as of the last assessment in October 2019. The dam undergoes inspections every five years to ensure its safety and functionality. In case of emergencies, there are plans in place to manage any risks posed by the dam, though further details about emergency preparedness are not available at this time.
For water resource and climate enthusiasts, Cinnamon Lake Dam offers a fascinating insight into the intersection of human engineering and natural landscapes. With its recreational purpose and potential environmental impact, this dam serves as a valuable case study for understanding the complexities of managing water resources in a changing climate. The dam's location on the Muddy Fork river adds to its significance, highlighting the interconnectedness of water systems in the region and the need for sustainable water management practices.
Plan around the weather
Same NOAA / yr.no feed Snoflo's iOS app uses. Watch the precipitation column on the meteogram -- rain on the basin upstream typically lifts inflow 24-72 hours later.
Next 5 days, hour by hour
Temperature line with weather symbols on top, snow + rain accumulation as columns, humidity as a dotted line.
5-day forecast table
Every 3 hours, broken out across temperature, snow, rain, humidity, and wind. Each cell is colour-coded relative to the column min/max.
| Time | Condition | Temp (°F) | Snow (in) | Rain (in) | Humidity (%) | Wind (mps) | Wind dir |
|---|---|---|---|---|---|---|---|
| Loading detailed forecast… | |||||||
15-day temperature & precipitation
Daily temperatures, snow, and rain projected over the next two weeks.
Nearby streamflow gauges
USGS streamgauges around Cinnamon Lake Dam -- inflows here typically show up in storage 24-72 hours later.
| Streamgauge | Discharge | View |
|---|---|---|
| Chippewa Creek At Miller Rd At Sterling Oh | 2 cfs | → |
| Black Fork Mohican River At Shelby Oh | 1 cfs | → |
| Black River At Elyria Oh | 25 cfs | → |
| Vermilion River Near Vermilion Oh | 27 cfs | → |
| West Branch Rocky River At West View Oh | 19 cfs | → |
| Plum Creek Near Olmsted Falls Oh | 0 cfs | → |


About Cinnamon Lake Dam
Where does the data for Cinnamon Lake Dam come from?
Structural and regulatory data come from the U.S. Army Corps of Engineers' National Inventory of Dams (NID). Weather forecast comes from NOAA / yr.no -- the same feed Snoflo's iOS app uses.
How often is the report updated?
NID structural data refreshes annually as the Corps publishes updated assessments. The weather forecast refreshes throughout the day.
What does the High hazard rating mean?
The Corps of Engineers' hazard potential classification grades probable consequences if the dam fails: High = probable loss of human life; Significant = no probable loss of human life but possible economic loss / environmental damage; Low = no probable loss of human life, only minor economic / environmental losses. See the Dam Data Reference card below for the full definitions.
What's "% of normal"?
The current storage value compared to the historical average storage on this calendar day. 100% = right on average; values above 100% mean above-normal storage (wet year); values below mean below-normal (dry year or drought).
Can I get alerts when storage crosses a threshold?
Yes -- alerts are managed in the Snoflo iOS app. Favorite this dam, set a threshold, and you'll get a push the moment conditions cross.
Dam data reference
Condition Assessment
- Satisfactory
- No existing or potential dam safety deficiencies are recognized. Acceptable performance is expected under all loading conditions (static, hydrologic, seismic) in accordance with the minimum applicable state or federal regulatory criteria or tolerable risk guidelines.
- Fair
- No existing dam safety deficiencies are recognized for normal operating conditions. Rare or extreme hydrologic and/or seismic events may result in a dam safety deficiency. Risk may be in the range to take further action.
- Poor
- A dam safety deficiency is recognized for normal operating conditions which may realistically occur. Remedial action is necessary. POOR may also be used when uncertainties exist as to critical analysis parameters which identify a potential dam safety deficiency.
- Unsatisfactory
- A dam safety deficiency is recognized that requires immediate or emergency remedial action for problem resolution.
- Not Rated
- The dam has not been inspected, is not under state or federal jurisdiction, or has been inspected but, for whatever reason, has not been rated.
Hazard Potential Classification
- High
- Dams assigned the high hazard potential classification are those where failure or mis-operation will probably cause loss of human life.
- Significant
- Dams assigned the significant hazard potential classification are those dams where failure or mis-operation results in no probable loss of human life but can cause economic loss, environmental damage, disruption of lifeline facilities, or impact other concerns. Significant hazard potential classification dams are often located in predominantly rural or agricultural areas but could be in areas with population and significant infrastructure.
- Low
- Dams assigned the low hazard potential classification are those where failure or mis-operation results in no probable loss of human life and low economic and/or environmental losses. Losses are principally limited to the owner's property.
- Undetermined
- Dams for which a downstream hazard potential has not been designated or is not provided.