Tucaway Lake Dam dam

Tucaway Lake Dam
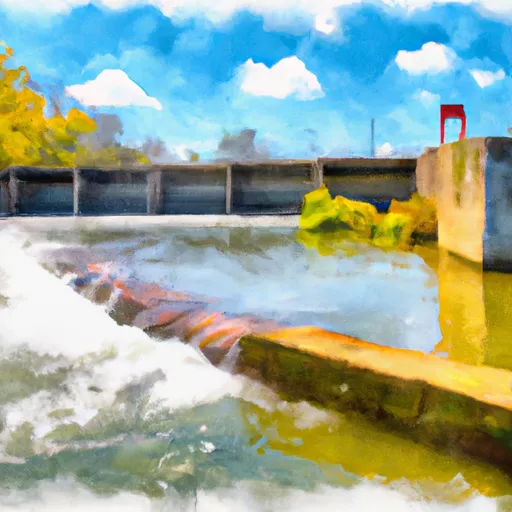
Tucaway Lake Dam, located in Kent, Ohio, stands as a vital structure along the Eckert Ditch, serving as a recreational hub for water resource and climate enthusiasts. Constructed in 1973, this earth dam boasts a height of 24.7 feet and a length of 875 feet, offering a serene surface area of 64 acres and a drainage area of 1.96 square miles. With a normal storage capacity of 326 acre-feet and a maximum discharge rate of 9,552 cubic feet per second, Tucaway Lake Dam provides both leisure and protection to the surrounding community.
Owned privately and regulated by the Ohio Department of Natural Resources, Tucaway Lake Dam presents a high hazard potential but maintains a satisfactory condition assessment as of April 2016. Designed by Robert E. Phillips, P.E., of Chardon, Ohio, this dam undergoes state inspection, permitting, and enforcement to ensure its structural integrity and safety. Situated within the Buffalo District, Tucaway Lake Dam epitomizes the harmonious blend of recreation and environmental preservation, offering a tranquil oasis for residents and visitors alike to enjoy.
As a significant component of the local water infrastructure, Tucaway Lake Dam plays a crucial role in flood control, water supply management, and recreational activities. With its impressive storage capacity of 1,163 acre-feet and a maximum storage of 1,163 acre-feet, this dam serves as a vital resource for the community. Despite its high hazard potential, Tucaway Lake Dam continues to stand as a testament to effective design and maintenance, ensuring the safety and well-being of all those who benefit from its presence along the picturesque Eckert Ditch in Portage County, Ohio.
Plan around the weather
Same NOAA / yr.no feed Snoflo's iOS app uses. Watch the precipitation column on the meteogram -- rain on the basin upstream typically lifts inflow 24-72 hours later.
Next 5 days, hour by hour
Temperature line with weather symbols on top, snow + rain accumulation as columns, humidity as a dotted line.
5-day forecast table
Every 3 hours, broken out across temperature, snow, rain, humidity, and wind. Each cell is colour-coded relative to the column min/max.
| Time | Condition | Temp (°F) | Snow (in) | Rain (in) | Humidity (%) | Wind (mps) | Wind dir |
|---|---|---|---|---|---|---|---|
| Loading detailed forecast… | |||||||
15-day temperature & precipitation
Daily temperatures, snow, and rain projected over the next two weeks.
Nearby streamflow gauges
USGS streamgauges around Tucaway Lake Dam -- inflows here typically show up in storage 24-72 hours later.
| Streamgauge | Discharge | View |
|---|---|---|
| Cuyahoga River At Hiram Rapids Oh | 127 cfs | → |
| West Branch Mahoning River At Wayland Oh | 31 cfs | → |
| Indian Creek Near Macedonia Oh | 0 cfs | → |
| Brandywine Creek Near Macedonia Oh | 1 cfs | → |
| Cuyahoga River At Old Portage Oh | 511 cfs | → |
| Cuyahoga River At Jaite Oh | 607 cfs | → |


About Tucaway Lake Dam
Where does the data for Tucaway Lake Dam come from?
Structural and regulatory data come from the U.S. Army Corps of Engineers' National Inventory of Dams (NID). Weather forecast comes from NOAA / yr.no -- the same feed Snoflo's iOS app uses.
How often is the report updated?
NID structural data refreshes annually as the Corps publishes updated assessments. The weather forecast refreshes throughout the day.
What does the High hazard rating mean?
The Corps of Engineers' hazard potential classification grades probable consequences if the dam fails: High = probable loss of human life; Significant = no probable loss of human life but possible economic loss / environmental damage; Low = no probable loss of human life, only minor economic / environmental losses. See the Dam Data Reference card below for the full definitions.
What's "% of normal"?
The current storage value compared to the historical average storage on this calendar day. 100% = right on average; values above 100% mean above-normal storage (wet year); values below mean below-normal (dry year or drought).
Can I get alerts when storage crosses a threshold?
Yes -- alerts are managed in the Snoflo iOS app. Favorite this dam, set a threshold, and you'll get a push the moment conditions cross.
Dam data reference
Condition Assessment
- Satisfactory
- No existing or potential dam safety deficiencies are recognized. Acceptable performance is expected under all loading conditions (static, hydrologic, seismic) in accordance with the minimum applicable state or federal regulatory criteria or tolerable risk guidelines.
- Fair
- No existing dam safety deficiencies are recognized for normal operating conditions. Rare or extreme hydrologic and/or seismic events may result in a dam safety deficiency. Risk may be in the range to take further action.
- Poor
- A dam safety deficiency is recognized for normal operating conditions which may realistically occur. Remedial action is necessary. POOR may also be used when uncertainties exist as to critical analysis parameters which identify a potential dam safety deficiency.
- Unsatisfactory
- A dam safety deficiency is recognized that requires immediate or emergency remedial action for problem resolution.
- Not Rated
- The dam has not been inspected, is not under state or federal jurisdiction, or has been inspected but, for whatever reason, has not been rated.
Hazard Potential Classification
- High
- Dams assigned the high hazard potential classification are those where failure or mis-operation will probably cause loss of human life.
- Significant
- Dams assigned the significant hazard potential classification are those dams where failure or mis-operation results in no probable loss of human life but can cause economic loss, environmental damage, disruption of lifeline facilities, or impact other concerns. Significant hazard potential classification dams are often located in predominantly rural or agricultural areas but could be in areas with population and significant infrastructure.
- Low
- Dams assigned the low hazard potential classification are those where failure or mis-operation results in no probable loss of human life and low economic and/or environmental losses. Losses are principally limited to the owner's property.
- Undetermined
- Dams for which a downstream hazard potential has not been designated or is not provided.