Scott Dam Dam

Scott Dam
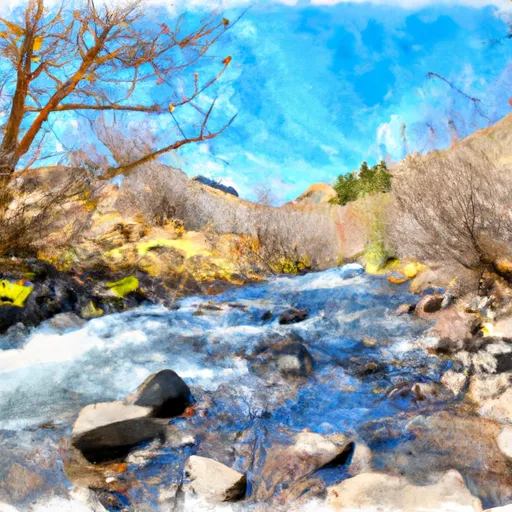
Located in Malheur County, Oregon, the Scott Dam stands as a testament to early 20th-century engineering, having been completed in 1911 with a primary purpose of irrigation. Positioned on Jerry Creek, this earth dam boasts a height of 18 feet and a hydraulic height of 16 feet, providing a storage capacity of up to 160 acre-feet. With a spillway type not specified and a hazard potential rated as low, the dam serves as a vital water resource for the surrounding area.
Owned by a private entity, Scott Dam falls under state regulation by the Oregon Water Resources Department, ensuring that it undergoes inspection, permitting, and enforcement to maintain its structural integrity and water management capabilities. With a surface area of 14.6 acres and a normal storage capacity of 146 acre-feet, the dam plays a crucial role in supporting agricultural irrigation in the region. Its outlet gates, consisting of slide (sluice gate) mechanisms, further demonstrate its importance in water flow control and distribution.
Despite its age, Scott Dam continues to serve as a key component in the water infrastructure of Juntura, Oregon. With a history of providing essential irrigation water to the area and a low hazard potential, the dam remains a reliable resource for water users and climate enthusiasts alike. Its state-regulated status and adherence to inspection protocols ensure that it will continue to play a vital role in water management for years to come.
Plan around the weather
Same NOAA / yr.no feed Snoflo's iOS app uses. Watch the precipitation column on the meteogram -- rain on the basin upstream typically lifts inflow 24-72 hours later.
Next 5 days, hour by hour
Temperature line with weather symbols on top, snow + rain accumulation as columns, humidity as a dotted line.
5-day forecast table
Every 3 hours, broken out across temperature, snow, rain, humidity, and wind. Each cell is colour-coded relative to the column min/max.
| Time | Condition | Temp (°F) | Snow (in) | Rain (in) | Humidity (%) | Wind (mps) | Wind dir |
|---|---|---|---|---|---|---|---|
| Loading detailed forecast… | |||||||
15-day temperature & precipitation
Daily temperatures, snow, and rain projected over the next two weeks.
Nearby streamflow gauges
USGS streamgauges around Scott Dam -- inflows here typically show up in storage 24-72 hours later.
| Streamgauge | Discharge | View |
|---|---|---|
| North Fork Malheur River At Beulah Or | 1 cfs | → |
| Malheur R Be Warmsprings Res Nr Riverside Or | 0 cfs | → |
| John Day R At Blue Mtn Hot Spgs Nr Prairie City | 22 cfs | → |
| Malheur River Below Nevada Dam Near Vale Or | 33 cfs | → |
| Owyhee River Below Owyhee Dam Or | 120 cfs | → |
| John Day River Near John Day | 34 cfs | → |


About Scott Dam
Where does the data for Scott Dam come from?
Structural and regulatory data come from the U.S. Army Corps of Engineers' National Inventory of Dams (NID). Weather forecast comes from NOAA / yr.no -- the same feed Snoflo's iOS app uses.
How often is the report updated?
NID structural data refreshes annually as the Corps publishes updated assessments. The weather forecast refreshes throughout the day.
What does the Low hazard rating mean?
The Corps of Engineers' hazard potential classification grades probable consequences if the dam fails: High = probable loss of human life; Significant = no probable loss of human life but possible economic loss / environmental damage; Low = no probable loss of human life, only minor economic / environmental losses. See the Dam Data Reference card below for the full definitions.
What's "% of normal"?
The current storage value compared to the historical average storage on this calendar day. 100% = right on average; values above 100% mean above-normal storage (wet year); values below mean below-normal (dry year or drought).
Can I get alerts when storage crosses a threshold?
Yes -- alerts are managed in the Snoflo iOS app. Favorite this dam, set a threshold, and you'll get a push the moment conditions cross.
Dam data reference
Condition Assessment
- Satisfactory
- No existing or potential dam safety deficiencies are recognized. Acceptable performance is expected under all loading conditions (static, hydrologic, seismic) in accordance with the minimum applicable state or federal regulatory criteria or tolerable risk guidelines.
- Fair
- No existing dam safety deficiencies are recognized for normal operating conditions. Rare or extreme hydrologic and/or seismic events may result in a dam safety deficiency. Risk may be in the range to take further action.
- Poor
- A dam safety deficiency is recognized for normal operating conditions which may realistically occur. Remedial action is necessary. POOR may also be used when uncertainties exist as to critical analysis parameters which identify a potential dam safety deficiency.
- Unsatisfactory
- A dam safety deficiency is recognized that requires immediate or emergency remedial action for problem resolution.
- Not Rated
- The dam has not been inspected, is not under state or federal jurisdiction, or has been inspected but, for whatever reason, has not been rated.
Hazard Potential Classification
- High
- Dams assigned the high hazard potential classification are those where failure or mis-operation will probably cause loss of human life.
- Significant
- Dams assigned the significant hazard potential classification are those dams where failure or mis-operation results in no probable loss of human life but can cause economic loss, environmental damage, disruption of lifeline facilities, or impact other concerns. Significant hazard potential classification dams are often located in predominantly rural or agricultural areas but could be in areas with population and significant infrastructure.
- Low
- Dams assigned the low hazard potential classification are those where failure or mis-operation results in no probable loss of human life and low economic and/or environmental losses. Losses are principally limited to the owner's property.
- Undetermined
- Dams for which a downstream hazard potential has not been designated or is not provided.