Proctor Lk Nr Proctor Reservoir
As of July 16, 2026, Proctor Lk Nr Proctor is holding 4 mph of water — 75% of normal storage for this date. Storage data refreshed throughout the day.

Proctor Lk Nr Proctor
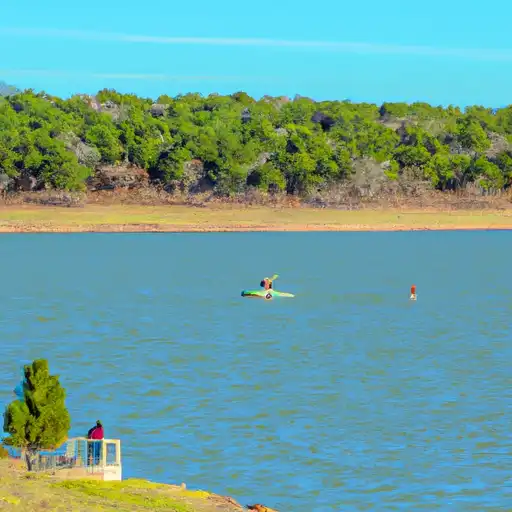
Proctor Lake, located near Proctor, TX in Texas, was constructed in 1963 by the United States Army Corps of Engineers for flood control, water supply, and recreational purposes. The lake spans 4,537 acres and has a storage capacity of 203,200 acre-feet of water. The hydrology of the lake is primarily fed by the Leon River and other small tributaries.
The surface flow providers for Proctor Lake include the Leon River and the nearby lakes of Lake Brownwood, Lake Whitney, and Lake Granbury.
Proctor Lake is utilized for agricultural purposes such as irrigation, as well as for recreational activities such as boating, fishing, and camping. It is also home to several parks, including the Sowell Creek Park, Copperas Creek Park, and Proctor Lake Park. The lake provides a scenic environment for outdoor enthusiasts to enjoy.
Daily levels at Proctor Lk Nr Proctor
Storage volume, pool elevation, and total release plotted from the operating agency's daily observations.
Precipitation, total, in
in · code 00045
Wind direction, degrees clockwise from north
Deg · code 00036
Wind speed, mph
mph · code 00035
Plan around the weather
Same NOAA / yr.no feed Snoflo's iOS app uses. Watch the precipitation column on the meteogram -- rain on the basin upstream typically lifts inflow 24-72 hours later.
Next 5 days, hour by hour
Temperature line with weather symbols on top, snow + rain accumulation as columns, humidity as a dotted line.
5-day forecast table
Every 3 hours, broken out across temperature, snow, rain, humidity, and wind. Each cell is colour-coded relative to the column min/max.
| Time | Condition | Temp (°F) | Snow (in) | Rain (in) | Humidity (%) | Wind (mps) | Wind dir |
|---|---|---|---|---|---|---|---|
| Loading detailed forecast… | |||||||
15-day temperature & precipitation
Daily temperatures, snow, and rain projected over the next two weeks.
Nearby streamflow gauges
USGS streamgauges around Proctor Lk Nr Proctor -- inflows here typically show up in storage 24-72 hours later.
| Streamgauge | Discharge | View |
|---|---|---|
| Leon Rv Nr Hasse | 12 cfs | → |
| Copperas Ck At Fm 2247 Nr Comanche | 350 cfs | → |
| Sabana Rv Nr De Leon | 0 cfs | → |
| Leon Rv Nr De Leon | · | → |
| Leon Rv Nr Hamilton | 263 cfs | → |
| N Bosque Rv At Hico | 8 cfs | → |


About Proctor Lk Nr Proctor
Where does the data for Proctor Lk Nr Proctor come from?
Daily storage, pool elevation, and release rates are sourced from USGS, USBR, and USACE monitoring stations. Weather forecast comes from NOAA / yr.no -- the same feed Snoflo's iOS app uses.
How often is the report updated?
Storage observations are updated daily by the operating agency. The 15-day weather forecast refreshes throughout the day. Snoflo caches and renders the most recent observation -- check the "as of" timestamp on the storage card.
What does the Hazard hazard rating mean?
The Corps of Engineers' hazard potential classification grades probable consequences if the dam fails: High = probable loss of human life; Significant = no probable loss of human life but possible economic loss / environmental damage; Low = no probable loss of human life, only minor economic / environmental losses. See the Dam Data Reference card below for the full definitions.
What's "% of normal"?
The current storage value compared to the historical average storage on this calendar day. 100% = right on average; values above 100% mean above-normal storage (wet year); values below mean below-normal (dry year or drought).
Can I get alerts when storage crosses a threshold?
Yes -- alerts are managed in the Snoflo iOS app. Favorite this reservoir, set a threshold, and you'll get a push the moment conditions cross.