Dry Wash No. 2 Dam

Dry Wash No. 2
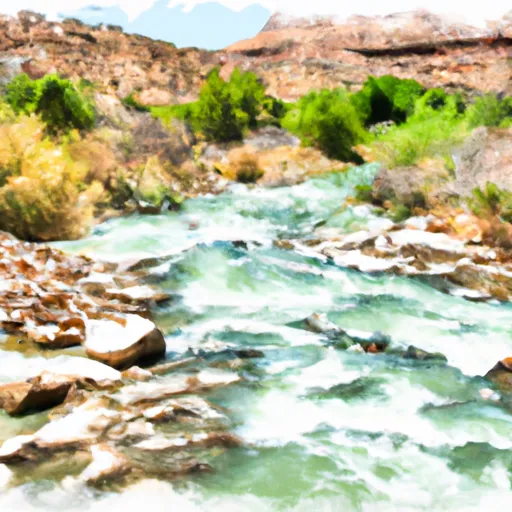
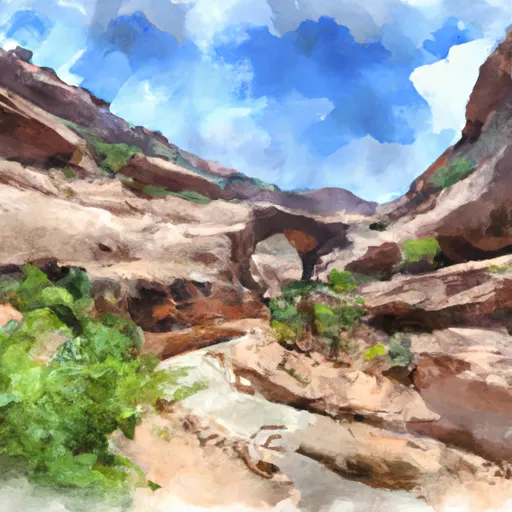
Dry Wash No. 2 is a significant irrigation structure located in San Juan, Utah, along Johnson Creek. Constructed in 1962 by the USDA NRCS, this earth dam stands at a hydraulic height of 63 feet and a structural height of 68 feet, with a storage capacity of 660 acre-feet. The dam serves the primary purpose of irrigation and is regulated by the Utah Division of Water Rights, ensuring that it meets state standards for inspection, enforcement, and permitting.
Managed by a private owner, Dry Wash No. 2 plays a crucial role in water resource management in the region, with a drainage area of 0.14 square miles and a maximum discharge of 72 cubic feet per second. The dam's spillway width of 40 feet and inspection frequency of every two years highlight its importance in maintaining water quality and safety for downstream communities. Despite its significant hazard potential, with a condition assessment currently listed as "Not Rated," efforts are being made to ensure the structure's integrity through regular inspections and potential emergency action planning.
As a key component of the local water infrastructure, Dry Wash No. 2 represents the intersection of climate resilience and resource management in the arid landscape of Utah. With its earth core and stone foundation, this dam stands as a testament to the collaborative efforts of federal and state agencies in safeguarding water resources for agricultural purposes. Its location in Blanding, Utah, under the jurisdiction of the Sacramento District, showcases the importance of strategic water storage and distribution in mitigating the impacts of a changing climate on regional water availability.
Plan around the weather
Same NOAA / yr.no feed Snoflo's iOS app uses. Watch the precipitation column on the meteogram -- rain on the basin upstream typically lifts inflow 24-72 hours later.
Next 5 days, hour by hour
Temperature line with weather symbols on top, snow + rain accumulation as columns, humidity as a dotted line.
5-day forecast table
Every 3 hours, broken out across temperature, snow, rain, humidity, and wind. Each cell is colour-coded relative to the column min/max.
| Time | Condition | Temp (°F) | Snow (in) | Rain (in) | Humidity (%) | Wind (mps) | Wind dir |
|---|---|---|---|---|---|---|---|
| Loading detailed forecast… | |||||||
15-day temperature & precipitation
Daily temperatures, snow, and rain projected over the next two weeks.
Nearby streamflow gauges
USGS streamgauges around Dry Wash No. 2 -- inflows here typically show up in storage 24-72 hours later.
| Streamgauge | Discharge | View |
|---|---|---|
| Recapture Creek Near Blanding | · | → |
| South Creek Above Reservoir Near Monticello | 0 cfs | → |
| Dolores River Near Slick Rock | 4 cfs | → |
| Mcelmo Creek Near Colorado-Utah State Line | 4 cfs | → |
| San Juan River Near Bluff | 1,020 cfs | → |
| Mill Creek At Sheley Tunnel | 6 cfs | → |


About Dry Wash No. 2
Where does the data for Dry Wash No. 2 come from?
Structural and regulatory data come from the U.S. Army Corps of Engineers' National Inventory of Dams (NID). Weather forecast comes from NOAA / yr.no -- the same feed Snoflo's iOS app uses.
How often is the report updated?
NID structural data refreshes annually as the Corps publishes updated assessments. The weather forecast refreshes throughout the day.
What does the Significant hazard rating mean?
The Corps of Engineers' hazard potential classification grades probable consequences if the dam fails: High = probable loss of human life; Significant = no probable loss of human life but possible economic loss / environmental damage; Low = no probable loss of human life, only minor economic / environmental losses. See the Dam Data Reference card below for the full definitions.
What's "% of normal"?
The current storage value compared to the historical average storage on this calendar day. 100% = right on average; values above 100% mean above-normal storage (wet year); values below mean below-normal (dry year or drought).
Can I get alerts when storage crosses a threshold?
Yes -- alerts are managed in the Snoflo iOS app. Favorite this dam, set a threshold, and you'll get a push the moment conditions cross.
Dam data reference
Condition Assessment
- Satisfactory
- No existing or potential dam safety deficiencies are recognized. Acceptable performance is expected under all loading conditions (static, hydrologic, seismic) in accordance with the minimum applicable state or federal regulatory criteria or tolerable risk guidelines.
- Fair
- No existing dam safety deficiencies are recognized for normal operating conditions. Rare or extreme hydrologic and/or seismic events may result in a dam safety deficiency. Risk may be in the range to take further action.
- Poor
- A dam safety deficiency is recognized for normal operating conditions which may realistically occur. Remedial action is necessary. POOR may also be used when uncertainties exist as to critical analysis parameters which identify a potential dam safety deficiency.
- Unsatisfactory
- A dam safety deficiency is recognized that requires immediate or emergency remedial action for problem resolution.
- Not Rated
- The dam has not been inspected, is not under state or federal jurisdiction, or has been inspected but, for whatever reason, has not been rated.
Hazard Potential Classification
- High
- Dams assigned the high hazard potential classification are those where failure or mis-operation will probably cause loss of human life.
- Significant
- Dams assigned the significant hazard potential classification are those dams where failure or mis-operation results in no probable loss of human life but can cause economic loss, environmental damage, disruption of lifeline facilities, or impact other concerns. Significant hazard potential classification dams are often located in predominantly rural or agricultural areas but could be in areas with population and significant infrastructure.
- Low
- Dams assigned the low hazard potential classification are those where failure or mis-operation results in no probable loss of human life and low economic and/or environmental losses. Losses are principally limited to the owner's property.
- Undetermined
- Dams for which a downstream hazard potential has not been designated or is not provided.