Jersey Dam

Jersey
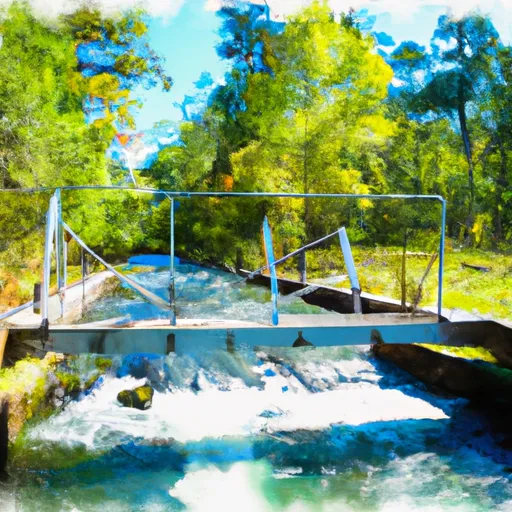
Jersey is a captivating hydroelectric dam located in Tomahawk, Wisconsin, along the picturesque Tomahawk River. Built in 1929 by Byllesby, this gravity dam stands at a height of 34 feet and has a structural height of 28 feet, providing essential power generation and flood control capabilities. With a normal storage capacity of 1594 acre-feet and a maximum discharge of 24000 cubic feet per second, Jersey plays a crucial role in managing water resources in the region.
Owned by a Public Utility and regulated by the Federal Energy Regulatory Commission, Jersey is a vital piece of infrastructure with a high hazard potential due to its location and design. The dam boasts a controlled spillway and various outlet gates, including a slide gate and four radial gates, ensuring efficient water flow management. Despite its age, the dam's risk assessment ranks as very high, highlighting the importance of ongoing monitoring and maintenance to ensure its continued safe operation.
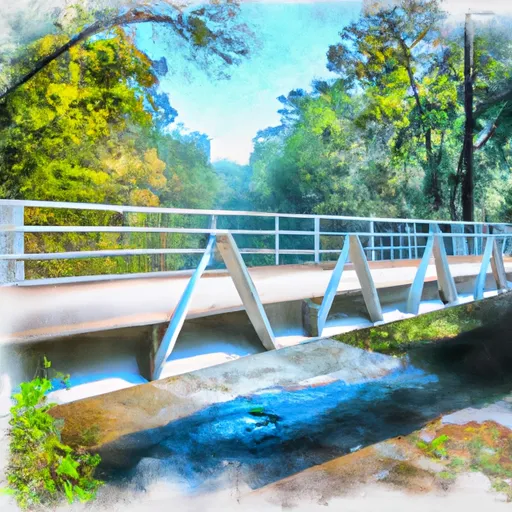
Visitors to Jersey can admire its multi-arch design and rock foundation, as well as the beautiful surrounding area of Lincoln County, Wisconsin. With its rich history and significant role in water resource management, Jersey stands as a testament to the intersection of engineering excellence and environmental stewardship in the face of climate challenges.
Plan around the weather
Same NOAA / yr.no feed Snoflo's iOS app uses. Watch the precipitation column on the meteogram -- rain on the basin upstream typically lifts inflow 24-72 hours later.
Next 5 days, hour by hour
Temperature line with weather symbols on top, snow + rain accumulation as columns, humidity as a dotted line.
5-day forecast table
Every 3 hours, broken out across temperature, snow, rain, humidity, and wind. Each cell is colour-coded relative to the column min/max.
| Time | Condition | Temp (°F) | Snow (in) | Rain (in) | Humidity (%) | Wind (mps) | Wind dir |
|---|---|---|---|---|---|---|---|
| Loading detailed forecast… | |||||||
15-day temperature & precipitation
Daily temperatures, snow, and rain projected over the next two weeks.
Nearby streamflow gauges
USGS streamgauges around Jersey -- inflows here typically show up in storage 24-72 hours later.
| Streamgauge | Discharge | View |
|---|---|---|
| Spirit River At Spirit Falls | 6 cfs | → |
| Prairie River Near Merrill | 102 cfs | → |
| Wisconsin River At Merrill | 1,320 cfs | → |
| Wisconsin River @ Rainbow Lake Nr Lake Tomahawk | 413 cfs | → |
| Muskellunge Creek Near St. Germain | 9 cfs | → |
| Muskellunge Ck-Muskellunge L Otl-Nr Eagle River | 2 cfs | → |


About Jersey
Where does the data for Jersey come from?
Structural and regulatory data come from the U.S. Army Corps of Engineers' National Inventory of Dams (NID). Weather forecast comes from NOAA / yr.no -- the same feed Snoflo's iOS app uses.
How often is the report updated?
NID structural data refreshes annually as the Corps publishes updated assessments. The weather forecast refreshes throughout the day.
What does the High hazard rating mean?
The Corps of Engineers' hazard potential classification grades probable consequences if the dam fails: High = probable loss of human life; Significant = no probable loss of human life but possible economic loss / environmental damage; Low = no probable loss of human life, only minor economic / environmental losses. See the Dam Data Reference card below for the full definitions.
What's "% of normal"?
The current storage value compared to the historical average storage on this calendar day. 100% = right on average; values above 100% mean above-normal storage (wet year); values below mean below-normal (dry year or drought).
Can I get alerts when storage crosses a threshold?
Yes -- alerts are managed in the Snoflo iOS app. Favorite this dam, set a threshold, and you'll get a push the moment conditions cross.
Dam data reference
Condition Assessment
- Satisfactory
- No existing or potential dam safety deficiencies are recognized. Acceptable performance is expected under all loading conditions (static, hydrologic, seismic) in accordance with the minimum applicable state or federal regulatory criteria or tolerable risk guidelines.
- Fair
- No existing dam safety deficiencies are recognized for normal operating conditions. Rare or extreme hydrologic and/or seismic events may result in a dam safety deficiency. Risk may be in the range to take further action.
- Poor
- A dam safety deficiency is recognized for normal operating conditions which may realistically occur. Remedial action is necessary. POOR may also be used when uncertainties exist as to critical analysis parameters which identify a potential dam safety deficiency.
- Unsatisfactory
- A dam safety deficiency is recognized that requires immediate or emergency remedial action for problem resolution.
- Not Rated
- The dam has not been inspected, is not under state or federal jurisdiction, or has been inspected but, for whatever reason, has not been rated.
Hazard Potential Classification
- High
- Dams assigned the high hazard potential classification are those where failure or mis-operation will probably cause loss of human life.
- Significant
- Dams assigned the significant hazard potential classification are those dams where failure or mis-operation results in no probable loss of human life but can cause economic loss, environmental damage, disruption of lifeline facilities, or impact other concerns. Significant hazard potential classification dams are often located in predominantly rural or agricultural areas but could be in areas with population and significant infrastructure.
- Low
- Dams assigned the low hazard potential classification are those where failure or mis-operation results in no probable loss of human life and low economic and/or environmental losses. Losses are principally limited to the owner's property.
- Undetermined
- Dams for which a downstream hazard potential has not been designated or is not provided.