High Wind Watch
2026-11-18T14:00:00-07:00

* WHAT...West winds 20 to 30 mph with gusts up to 70-75 mph possible. * WHERE...The Northern Front Range Foothills. * WHEN...From late Tuesday night through Wednesday afternoon. * IMPACTS...Damaging winds could blow down trees and power lines. Widespread power outages are possible. Travel could be difficult, especially for high profile vehicles.
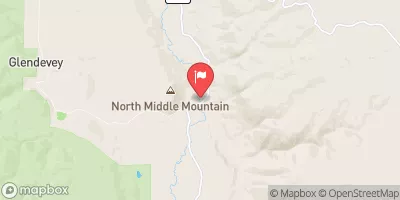
Laramie River Near Glendevey, Co. Historical Data

Historical Data


Streamflow Range


Date Average 2026 2025 2024 2023 2022 2021 2020 2019 2018 2017 2016 2015 2014 2013 2012 2011 2010
03-12 18.0
03-13 18.8
03-14 20.5
03-16 15.5
03-17 17.1
03-18 20.5
03-19 26.9
03-20 34.1
03-21 66.4
03-23 67.9
03-24 64.9
03-25 74.1
03-26 122.0
03-27 122.0
03-28 51.8
03-29 37.5
03-30 53.55
03-31 47.4
04-01 39.35
04-02 34.65
04-03 31.35
04-04 26.77
04-05 28.15
04-06 29.43
04-07 27.8
04-08 33.65
04-09 28.3
04-10 34.26
04-11 49.1
04-12 58.1
04-13 54.92
04-14 55.82
04-15 51.54
04-16 52.76
04-17 54.4
04-18 50.74
04-19 54.3
04-20 50.6
04-21 50.17
04-22 57.43
04-23 66.64
04-24 58.45
04-25 58.77
04-26 76.76
04-27 77.87
04-28 74.74
04-29 72.66
04-30 79.46
05-01 87.63
05-02 105.66
05-03 121.56
05-04 114.09
05-05 116.23
05-06 112.35
05-07 123.75
05-08 152.01
05-09 155.41
05-10 171.08
05-11 151.04
05-12 159.31
05-13 209.17
05-14 150.37
05-15 227.25
05-16 221.6
05-17 266.53
05-18 258.03
05-19 271.96
05-20 289.42
05-21 256.49
05-22 284.97
05-23 310.04
05-24 328.8
05-25 354.01
05-26 347.62
05-27 372.73
05-28 409.93
05-29 414.43
05-30 433.57
05-31 427.48
06-01 451.96
06-02 478.95
06-03 502.06
06-04 526.97
06-05 578.61
06-06 605.08
06-07 632.37
06-08 622.15
06-09 572.12
06-10 562.27
06-11 586.91
06-12 553.71
06-13 494.83
06-14 498.6
06-15 452.69
06-16 424.65
06-17 448.12
06-18 418.43
06-19 385.84
06-20 396.53
06-21 402.58
06-22 359.44
06-23 348.94
06-24 321.56
06-25 271.97
06-26 268.82
06-27 256.31
06-28 255.47
06-29 233.31
06-30 241.22
07-01 237.47
07-02 199.14
07-03 188.67
07-04 147.82
07-05 173.97
07-06 189.44
07-07 174.79
07-08 174.96
07-09 166.15
07-10 141.78
07-11 135.52
07-12 120.3
07-13 121.71
07-14 105.13
07-15 109.62
07-16 112.92
07-17 105.33
07-18 102.95
07-19 109.81
07-20 94.08
07-21 82.76
07-22 77.69
07-23 71.61
07-24 64.37
07-25 62.53
07-26 57.69
07-27 59.23
07-28 50.46
07-29 52.84
07-30 65.31
07-31 62.21
08-01 57.74
08-02 55.59
08-03 56.34
08-04 48.23
08-05 48.69
08-06 45.26
08-07 44.24
08-08 43.26
08-09 41.31
08-10 38.48
08-11 36.5
08-12 36.48
08-13 35.5
08-14 36.4
08-15 37.64
08-16 37.43
08-17 36.38
08-18 34.53
08-19 36.3
08-20 38.29
08-21 40.06
08-22 37.83
08-23 36.2
08-24 35.19
08-25 34.99
08-26 36.61
08-27 34.91
08-28 34.62
08-29 34.16
08-30 32.2
08-31 35.04
09-01 34.34
09-02 33.64
09-03 32.72
09-04 32.3
09-05 30.71
09-06 31.1
09-07 31.73
09-08 29.59
09-09 34.07
09-10 36.21
09-11 35.36
09-12 39.56
09-13 45.61
09-14 41.06
09-15 41.22
09-16 41.0
09-17 40.64
09-18 40.68
09-19 39.83
09-20 38.02
09-21 35.77
09-22 35.68
09-23 40.37
09-24 40.98
09-25 39.08
09-26 38.55
09-27 37.33
09-28 39.03
09-29 41.61
09-30 41.99
10-01 43.27
10-02 42.48
10-03 38.3
10-04 44.15
10-05 45.62
10-06 44.5
10-07 41.03
10-08 40.02
10-09 39.37
10-10 43.44
10-11 46.01
10-12 43.04
10-13 44.6
10-14 43.1
10-15 38.58
10-16 34.9
10-17 37.05
10-18 36.87
10-19 34.8
10-20 34.37
10-21 33.1
10-22 32.47
10-23 31.17
10-24 30.57
10-25 30.8
10-26 32.57
10-27 31.1
10-28 32.37
10-29 29.6
10-30 31.5
10-31 30.33
11-01 23.15
11-02 25.5
11-03 29.5
11-04 28.9
11-05 25.0
11-06 25.0
11-07 23.1
11-09 22.2
11-10 22.2

Annual Peak Streamflow


Seasonal Comparison


Oceanic Nino Index