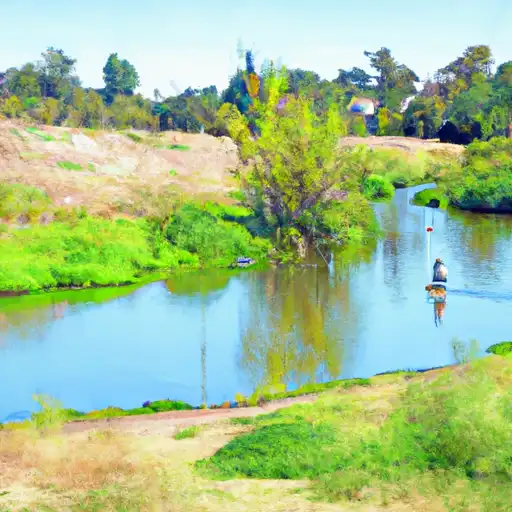
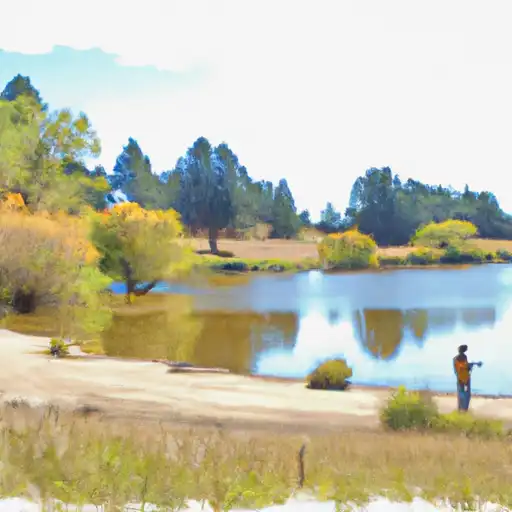
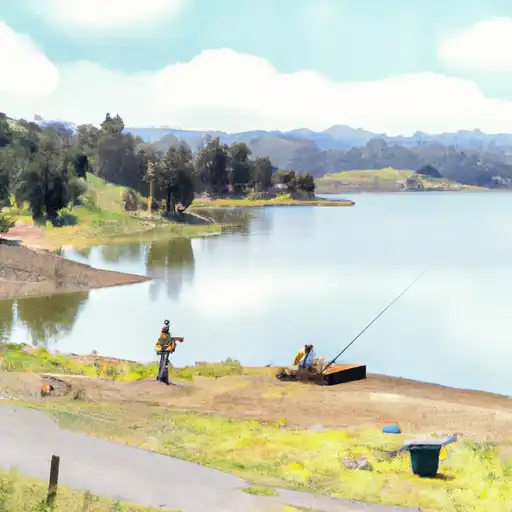
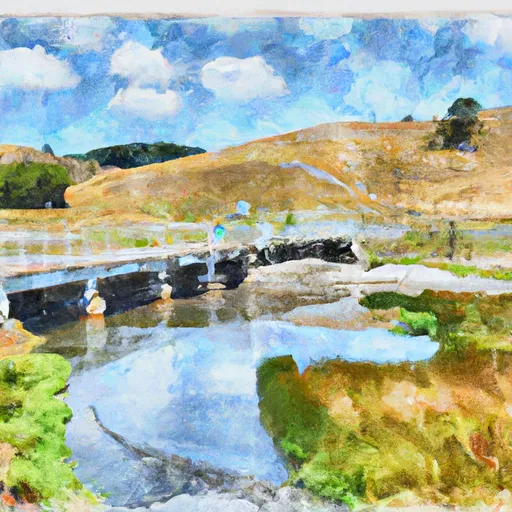
Shoreline Lake dam

Shoreline Lake
Shoreline Lake in Santa Clara, California, is a vital water resource managed by the local government for water supply and recreational purposes. This Earth dam stands at 18 feet high, with a hydraulic height of 13.2 feet, providing a storage capacity of 660 acre-feet. The lake covers an area of 47 acres and is regulated by the Department of Water Resources and Safety of Dams, ensuring its safety and maintenance.
Despite being classified as having low hazard potential, Shoreline Lake is regularly inspected and deemed to be in fair condition as of April 2019. The dam has a history of serving the community as a reliable water source while also offering recreational activities to residents and visitors. The dam's last inspection in November 2019 highlights the commitment to ensuring its safety and longevity for the surrounding area.
With its picturesque location and essential role in water supply, Shoreline Lake is a valuable asset in the Santa Clara region. Managed by local government authorities, the dam provides not only water security but also a serene setting for recreational activities. Its low hazard potential, coupled with regular inspections and fair condition assessment, showcases the dedication to maintaining this important water resource for the community's benefit.
Plan around the weather
Same NOAA / yr.no feed Snoflo's iOS app uses. Watch the precipitation column on the meteogram -- rain on the basin upstream typically lifts inflow 24-72 hours later.
Next 5 days, hour by hour
Temperature line with weather symbols on top, snow + rain accumulation as columns, humidity as a dotted line.
5-day forecast table
Every 3 hours, broken out across temperature, snow, rain, humidity, and wind. Each cell is colour-coded relative to the column min/max.
| Time | Condition | Temp (°F) | Snow (in) | Rain (in) | Humidity (%) | Wind (mps) | Wind dir |
|---|---|---|---|---|---|---|---|
| Loading detailed forecast… | |||||||
15-day temperature & precipitation
Daily temperatures, snow, and rain projected over the next two weeks.
Nearby streamflow gauges
USGS streamgauges around Shoreline Lake -- inflows here typically show up in storage 24-72 hours later.
| Streamgauge | Discharge | View |
|---|---|---|
| Matadero C A Palo Alto Ca | 0 cfs | → |
| San Francisquito C A Stanford University Ca | 0 cfs | → |
| Coyote C Ab Hwy 237 A Milipitas Ca | 8 cfs | → |
| Guadalupe R Abv Hwy 101 A San Jose Ca | 25 cfs | → |
| Alameda C Nr Fremont Ca | 17 cfs | → |
| Alameda C Flood Channel A Union City Ca | 17 cfs | → |


About Shoreline Lake
Where does the data for Shoreline Lake come from?
Structural and regulatory data come from the U.S. Army Corps of Engineers' National Inventory of Dams (NID). Weather forecast comes from NOAA / yr.no -- the same feed Snoflo's iOS app uses.
How often is the report updated?
NID structural data refreshes annually as the Corps publishes updated assessments. The weather forecast refreshes throughout the day.
What does the Low hazard rating mean?
The Corps of Engineers' hazard potential classification grades probable consequences if the dam fails: High = probable loss of human life; Significant = no probable loss of human life but possible economic loss / environmental damage; Low = no probable loss of human life, only minor economic / environmental losses. See the Dam Data Reference card below for the full definitions.
What's "% of normal"?
The current storage value compared to the historical average storage on this calendar day. 100% = right on average; values above 100% mean above-normal storage (wet year); values below mean below-normal (dry year or drought).
Can I get alerts when storage crosses a threshold?
Yes -- alerts are managed in the Snoflo iOS app. Favorite this dam, set a threshold, and you'll get a push the moment conditions cross.
Dam data reference
Condition Assessment
- Satisfactory
- No existing or potential dam safety deficiencies are recognized. Acceptable performance is expected under all loading conditions (static, hydrologic, seismic) in accordance with the minimum applicable state or federal regulatory criteria or tolerable risk guidelines.
- Fair
- No existing dam safety deficiencies are recognized for normal operating conditions. Rare or extreme hydrologic and/or seismic events may result in a dam safety deficiency. Risk may be in the range to take further action.
- Poor
- A dam safety deficiency is recognized for normal operating conditions which may realistically occur. Remedial action is necessary. POOR may also be used when uncertainties exist as to critical analysis parameters which identify a potential dam safety deficiency.
- Unsatisfactory
- A dam safety deficiency is recognized that requires immediate or emergency remedial action for problem resolution.
- Not Rated
- The dam has not been inspected, is not under state or federal jurisdiction, or has been inspected but, for whatever reason, has not been rated.
Hazard Potential Classification
- High
- Dams assigned the high hazard potential classification are those where failure or mis-operation will probably cause loss of human life.
- Significant
- Dams assigned the significant hazard potential classification are those dams where failure or mis-operation results in no probable loss of human life but can cause economic loss, environmental damage, disruption of lifeline facilities, or impact other concerns. Significant hazard potential classification dams are often located in predominantly rural or agricultural areas but could be in areas with population and significant infrastructure.
- Low
- Dams assigned the low hazard potential classification are those where failure or mis-operation results in no probable loss of human life and low economic and/or environmental losses. Losses are principally limited to the owner's property.
- Undetermined
- Dams for which a downstream hazard potential has not been designated or is not provided.