Upper Gorge dam

Upper Gorge
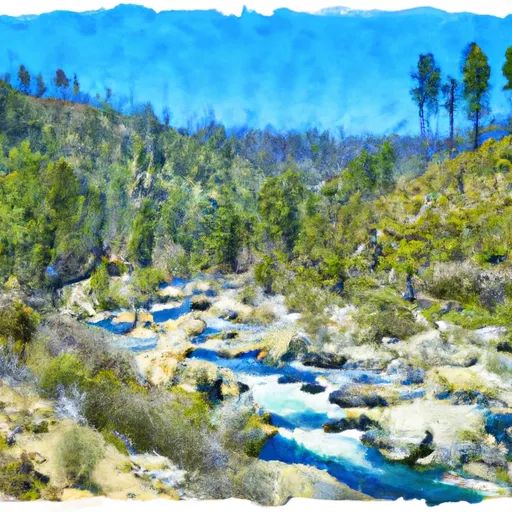
Upper Gorge is a gravity dam located in Bishop, California, along the Owens River. Completed in 1953, this structure stands at a height of 44 feet and has a hydraulic height of 35 feet. With a storage capacity of 26 acre-feet and serving the primary purpose of flood risk reduction, Upper Gorge plays a crucial role in managing water resources in the region. The dam is under the jurisdiction of the California Department of Water Resources and is regulated, permitted, inspected, and enforced by state agencies to ensure its safety and functionality.
Despite its age, Upper Gorge has been assessed to be in satisfactory condition with a low hazard potential. The last inspection was conducted in September 2019, with a regular inspection frequency of once a year. In case of emergencies, such as potential inundation events, the dam's emergency action plan (EAP) status and preparedness remain unclear, indicating a potential area for improvement. Overall, Upper Gorge serves as a vital infrastructure for flood risk reduction and hydroelectric purposes, contributing to the water management efforts in the Mono County region.
With its location in the picturesque Mono County, Upper Gorge not only provides flood protection but also adds to the scenic beauty of the area. Managed by local government authorities, this dam stands as a testament to human ingenuity in harnessing water resources while also highlighting the need for ongoing maintenance and preparedness for any potential risks. For water resource and climate enthusiasts, Upper Gorge presents a fascinating case study of dam infrastructure in California and the importance of effective regulation and inspection to ensure public safety and water security.
Plan around the weather
Same NOAA / yr.no feed Snoflo's iOS app uses. Watch the precipitation column on the meteogram -- rain on the basin upstream typically lifts inflow 24-72 hours later.
Next 5 days, hour by hour
Temperature line with weather symbols on top, snow + rain accumulation as columns, humidity as a dotted line.
5-day forecast table
Every 3 hours, broken out across temperature, snow, rain, humidity, and wind. Each cell is colour-coded relative to the column min/max.
| Time | Condition | Temp (°F) | Snow (in) | Rain (in) | Humidity (%) | Wind (mps) | Wind dir |
|---|---|---|---|---|---|---|---|
| Loading detailed forecast… | |||||||
15-day temperature & precipitation
Daily temperatures, snow, and rain projected over the next two weeks.
Nearby streamflow gauges
USGS streamgauges around Upper Gorge -- inflows here typically show up in storage 24-72 hours later.
| Streamgauge | Discharge | View |
|---|---|---|
| Hot C A Flume Nr Mammoth Lakes Ca | 49 cfs | → |
| Deadman C A Big Springs Nr Crestview Ca | 20 cfs | → |
| Mf San Joaquin R Nr Mammoth Lakes Ca | 96 cfs | → |
| Nf Willow C Nr Sugar Pine Ca | 416 cfs | → |
| Merced R A Happy Isles Bridge Nr Yosemite Ca | 151 cfs | → |
| Green Creek Near Bridgeport | 25 cfs | → |


About Upper Gorge
Where does the data for Upper Gorge come from?
Structural and regulatory data come from the U.S. Army Corps of Engineers' National Inventory of Dams (NID). Weather forecast comes from NOAA / yr.no -- the same feed Snoflo's iOS app uses.
How often is the report updated?
NID structural data refreshes annually as the Corps publishes updated assessments. The weather forecast refreshes throughout the day.
What does the Low hazard rating mean?
The Corps of Engineers' hazard potential classification grades probable consequences if the dam fails: High = probable loss of human life; Significant = no probable loss of human life but possible economic loss / environmental damage; Low = no probable loss of human life, only minor economic / environmental losses. See the Dam Data Reference card below for the full definitions.
What's "% of normal"?
The current storage value compared to the historical average storage on this calendar day. 100% = right on average; values above 100% mean above-normal storage (wet year); values below mean below-normal (dry year or drought).
Can I get alerts when storage crosses a threshold?
Yes -- alerts are managed in the Snoflo iOS app. Favorite this dam, set a threshold, and you'll get a push the moment conditions cross.
Dam data reference
Condition Assessment
- Satisfactory
- No existing or potential dam safety deficiencies are recognized. Acceptable performance is expected under all loading conditions (static, hydrologic, seismic) in accordance with the minimum applicable state or federal regulatory criteria or tolerable risk guidelines.
- Fair
- No existing dam safety deficiencies are recognized for normal operating conditions. Rare or extreme hydrologic and/or seismic events may result in a dam safety deficiency. Risk may be in the range to take further action.
- Poor
- A dam safety deficiency is recognized for normal operating conditions which may realistically occur. Remedial action is necessary. POOR may also be used when uncertainties exist as to critical analysis parameters which identify a potential dam safety deficiency.
- Unsatisfactory
- A dam safety deficiency is recognized that requires immediate or emergency remedial action for problem resolution.
- Not Rated
- The dam has not been inspected, is not under state or federal jurisdiction, or has been inspected but, for whatever reason, has not been rated.
Hazard Potential Classification
- High
- Dams assigned the high hazard potential classification are those where failure or mis-operation will probably cause loss of human life.
- Significant
- Dams assigned the significant hazard potential classification are those dams where failure or mis-operation results in no probable loss of human life but can cause economic loss, environmental damage, disruption of lifeline facilities, or impact other concerns. Significant hazard potential classification dams are often located in predominantly rural or agricultural areas but could be in areas with population and significant infrastructure.
- Low
- Dams assigned the low hazard potential classification are those where failure or mis-operation results in no probable loss of human life and low economic and/or environmental losses. Losses are principally limited to the owner's property.
- Undetermined
- Dams for which a downstream hazard potential has not been designated or is not provided.