Altura Dam

Altura
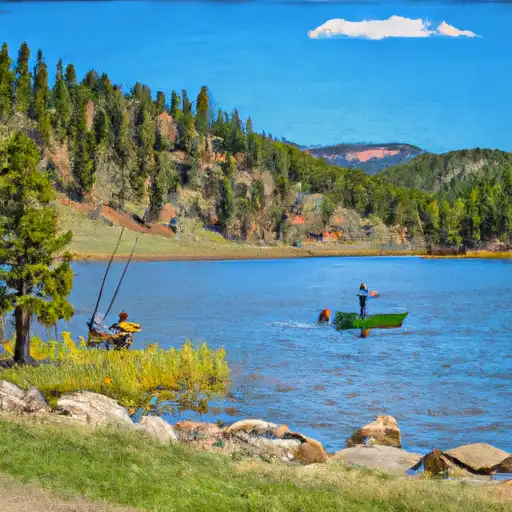
Altura, also known as Duck Lake, is a private dam located in Grant, Colorado, within Clear Creek County. Built in 1904, this Earth-type dam serves primarily for irrigation purposes along Duck Creek. With a height of 21 feet and a length of 270 feet, Altura has a storage capacity of 895 acre-feet, with a normal storage level of 610 acre-feet across its 47-acre surface area.
Managed by the Colorado Division of Water Resources, Altura is regulated, permitted, inspected, and enforced by state agencies to ensure its safety and functionality. Despite being categorized as having a low hazard potential, the dam is rated in satisfactory condition with a moderate risk assessment. The spillway at Altura is uncontrolled with a width of 17 feet, allowing for a maximum discharge of 124 cubic feet per second.
Altura stands as a testament to early 20th-century water management in Colorado, providing crucial irrigation support while maintaining a safe and reliable water resource for the surrounding area. Its historical significance, combined with its continued operational effectiveness, underscores the importance of responsible dam management in the face of evolving climate challenges.
Plan around the weather
Same NOAA / yr.no feed Snoflo's iOS app uses. Watch the precipitation column on the meteogram -- rain on the basin upstream typically lifts inflow 24-72 hours later.
Next 5 days, hour by hour
Temperature line with weather symbols on top, snow + rain accumulation as columns, humidity as a dotted line.
5-day forecast table
Every 3 hours, broken out across temperature, snow, rain, humidity, and wind. Each cell is colour-coded relative to the column min/max.
| Time | Condition | Temp (°F) | Snow (in) | Rain (in) | Humidity (%) | Wind (mps) | Wind dir |
|---|---|---|---|---|---|---|---|
| Loading detailed forecast… | |||||||
15-day temperature & precipitation
Daily temperatures, snow, and rain projected over the next two weeks.
Nearby streamflow gauges
USGS streamgauges around Altura -- inflows here typically show up in storage 24-72 hours later.
| Streamgauge | Discharge | View |
|---|---|---|
| South Clear Creek Abv Lower Cabin Creek Reservoir | 5 cfs | → |
| S Clear Cr Abv Lwr Cabin Cr Res Spilwy Nr Georgtwn | 6 cfs | → |
| Leavenworth Creek @ Mouth Nr Georgetown | 11 cfs | → |
| Snake River Near Montezuma | 34 cfs | → |
| Clear Creek Abv West Fork Clear Creek Nr Empire Co | 42 cfs | → |
| Chicago Creek Blw Devils Canyon Nr Idaho Sprgs Co | 5 cfs | → |


About Altura
Where does the data for Altura come from?
Structural and regulatory data come from the U.S. Army Corps of Engineers' National Inventory of Dams (NID). Weather forecast comes from NOAA / yr.no -- the same feed Snoflo's iOS app uses.
How often is the report updated?
NID structural data refreshes annually as the Corps publishes updated assessments. The weather forecast refreshes throughout the day.
What does the Low hazard rating mean?
The Corps of Engineers' hazard potential classification grades probable consequences if the dam fails: High = probable loss of human life; Significant = no probable loss of human life but possible economic loss / environmental damage; Low = no probable loss of human life, only minor economic / environmental losses. See the Dam Data Reference card below for the full definitions.
What's "% of normal"?
The current storage value compared to the historical average storage on this calendar day. 100% = right on average; values above 100% mean above-normal storage (wet year); values below mean below-normal (dry year or drought).
Can I get alerts when storage crosses a threshold?
Yes -- alerts are managed in the Snoflo iOS app. Favorite this dam, set a threshold, and you'll get a push the moment conditions cross.
Dam data reference
Condition Assessment
- Satisfactory
- No existing or potential dam safety deficiencies are recognized. Acceptable performance is expected under all loading conditions (static, hydrologic, seismic) in accordance with the minimum applicable state or federal regulatory criteria or tolerable risk guidelines.
- Fair
- No existing dam safety deficiencies are recognized for normal operating conditions. Rare or extreme hydrologic and/or seismic events may result in a dam safety deficiency. Risk may be in the range to take further action.
- Poor
- A dam safety deficiency is recognized for normal operating conditions which may realistically occur. Remedial action is necessary. POOR may also be used when uncertainties exist as to critical analysis parameters which identify a potential dam safety deficiency.
- Unsatisfactory
- A dam safety deficiency is recognized that requires immediate or emergency remedial action for problem resolution.
- Not Rated
- The dam has not been inspected, is not under state or federal jurisdiction, or has been inspected but, for whatever reason, has not been rated.
Hazard Potential Classification
- High
- Dams assigned the high hazard potential classification are those where failure or mis-operation will probably cause loss of human life.
- Significant
- Dams assigned the significant hazard potential classification are those dams where failure or mis-operation results in no probable loss of human life but can cause economic loss, environmental damage, disruption of lifeline facilities, or impact other concerns. Significant hazard potential classification dams are often located in predominantly rural or agricultural areas but could be in areas with population and significant infrastructure.
- Low
- Dams assigned the low hazard potential classification are those where failure or mis-operation results in no probable loss of human life and low economic and/or environmental losses. Losses are principally limited to the owner's property.
- Undetermined
- Dams for which a downstream hazard potential has not been designated or is not provided.