Cloud Lake Dam Dam

Cloud Lake Dam
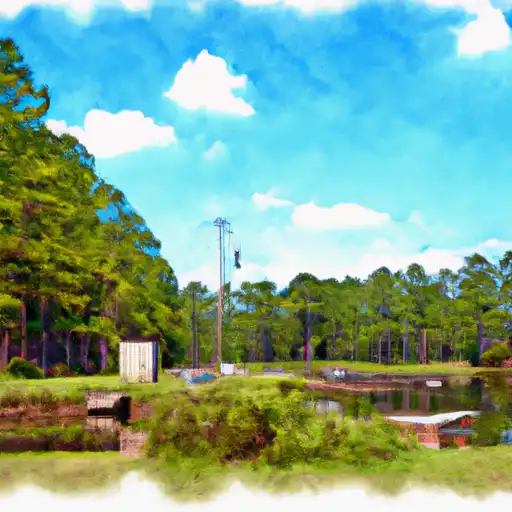
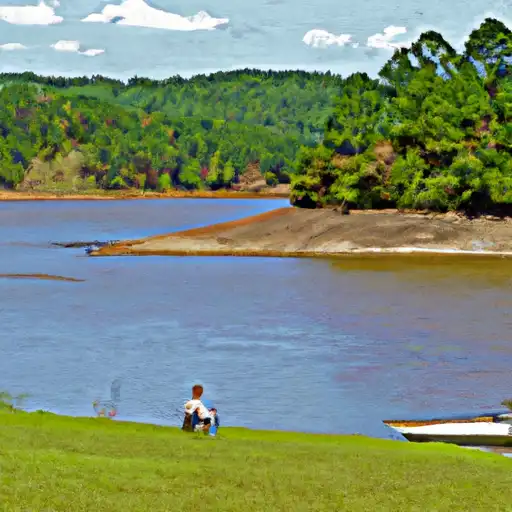
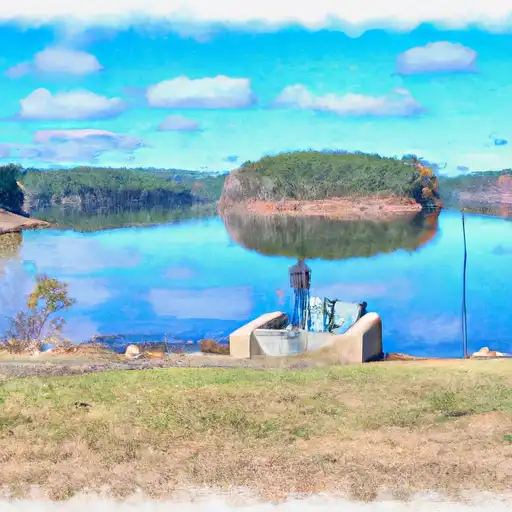
Cloud Lake Dam, located in Randolph County, Georgia, serves as a recreational hub for water resource and climate enthusiasts. Built in 1950, this private earth dam stands at a height of 15.6 feet and has a length of 570 feet, providing a storage capacity of 203.3 acre-feet. The dam overlooks Pachita Creek and boasts a surface area of 15.6 acres, making it an ideal spot for outdoor activities such as fishing, boating, and wildlife watching.
Although Cloud Lake Dam is classified as having a low hazard potential, it is important to note that the dam's condition has not been rated recently. However, it has undergone inspections every five years, with the last inspection conducted in July 2009. With its uncontrolled spillway and outlet gates, the dam is designed to manage moderate risks effectively. Despite not being regulated by the state, the dam's primary purpose of recreation underscores its significance in providing a safe and enjoyable environment for water enthusiasts in the region.
In conclusion, Cloud Lake Dam stands as a testament to the harmonious coexistence between human recreation and environmental conservation. Its strategic location, coupled with its functional design, offers a unique opportunity for visitors to engage with nature while also ensuring the safety and stability of the surrounding area. As water resource and climate enthusiasts continue to explore and appreciate the beauty of Cloud Lake Dam, it remains a vital asset in promoting sustainable practices and fostering a deeper connection with the natural world.
Plan around the weather
Same NOAA / yr.no feed Snoflo's iOS app uses. Watch the precipitation column on the meteogram -- rain on the basin upstream typically lifts inflow 24-72 hours later.
Next 5 days, hour by hour
Temperature line with weather symbols on top, snow + rain accumulation as columns, humidity as a dotted line.
5-day forecast table
Every 3 hours, broken out across temperature, snow, rain, humidity, and wind. Each cell is colour-coded relative to the column min/max.
| Time | Condition | Temp (°F) | Snow (in) | Rain (in) | Humidity (%) | Wind (mps) | Wind dir |
|---|---|---|---|---|---|---|---|
| Loading detailed forecast… | |||||||
15-day temperature & precipitation
Daily temperatures, snow, and rain projected over the next two weeks.
Nearby streamflow gauges
USGS streamgauges around Cloud Lake Dam -- inflows here typically show up in storage 24-72 hours later.
| Streamgauge | Discharge | View |
|---|---|---|
| Pachitla Creek Near Edison | 237 cfs | → |
| Kinchafoonee Creek At Preston | 64 cfs | → |
| Ichawaynochaway Creek At Ga 37 | 236 cfs | → |
| Hannahatchee Creek At Union | 29 cfs | → |
| Kinchafoonee Creek Near Dawson | 396 cfs | → |
| Ichawaynochaway Creek At Milford | 565 cfs | → |


About Cloud Lake Dam
Where does the data for Cloud Lake Dam come from?
Structural and regulatory data come from the U.S. Army Corps of Engineers' National Inventory of Dams (NID). Weather forecast comes from NOAA / yr.no -- the same feed Snoflo's iOS app uses.
How often is the report updated?
NID structural data refreshes annually as the Corps publishes updated assessments. The weather forecast refreshes throughout the day.
What does the Low hazard rating mean?
The Corps of Engineers' hazard potential classification grades probable consequences if the dam fails: High = probable loss of human life; Significant = no probable loss of human life but possible economic loss / environmental damage; Low = no probable loss of human life, only minor economic / environmental losses. See the Dam Data Reference card below for the full definitions.
What's "% of normal"?
The current storage value compared to the historical average storage on this calendar day. 100% = right on average; values above 100% mean above-normal storage (wet year); values below mean below-normal (dry year or drought).
Can I get alerts when storage crosses a threshold?
Yes -- alerts are managed in the Snoflo iOS app. Favorite this dam, set a threshold, and you'll get a push the moment conditions cross.
Dam data reference
Condition Assessment
- Satisfactory
- No existing or potential dam safety deficiencies are recognized. Acceptable performance is expected under all loading conditions (static, hydrologic, seismic) in accordance with the minimum applicable state or federal regulatory criteria or tolerable risk guidelines.
- Fair
- No existing dam safety deficiencies are recognized for normal operating conditions. Rare or extreme hydrologic and/or seismic events may result in a dam safety deficiency. Risk may be in the range to take further action.
- Poor
- A dam safety deficiency is recognized for normal operating conditions which may realistically occur. Remedial action is necessary. POOR may also be used when uncertainties exist as to critical analysis parameters which identify a potential dam safety deficiency.
- Unsatisfactory
- A dam safety deficiency is recognized that requires immediate or emergency remedial action for problem resolution.
- Not Rated
- The dam has not been inspected, is not under state or federal jurisdiction, or has been inspected but, for whatever reason, has not been rated.
Hazard Potential Classification
- High
- Dams assigned the high hazard potential classification are those where failure or mis-operation will probably cause loss of human life.
- Significant
- Dams assigned the significant hazard potential classification are those dams where failure or mis-operation results in no probable loss of human life but can cause economic loss, environmental damage, disruption of lifeline facilities, or impact other concerns. Significant hazard potential classification dams are often located in predominantly rural or agricultural areas but could be in areas with population and significant infrastructure.
- Low
- Dams assigned the low hazard potential classification are those where failure or mis-operation results in no probable loss of human life and low economic and/or environmental losses. Losses are principally limited to the owner's property.
- Undetermined
- Dams for which a downstream hazard potential has not been designated or is not provided.