Chickasaw Lake Dam Dam

Chickasaw Lake Dam
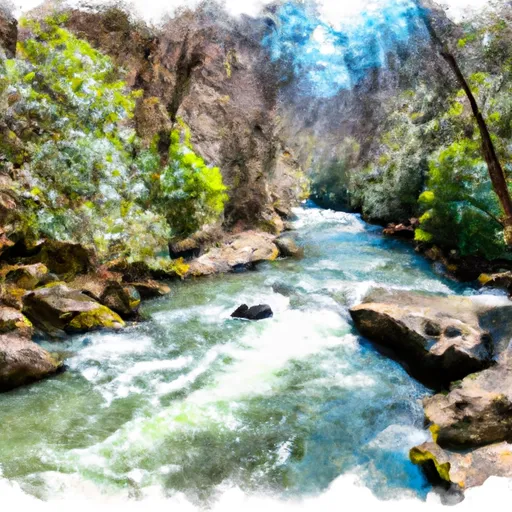
Chickasaw Lake Dam, nestled in the picturesque surroundings of Waleska, Georgia, stands as a vital structure along Lost Town Creek, serving primarily for recreational purposes. Constructed in 1974, this earth-type dam boasts a height of 27 feet and a hydraulic height of 50 feet, with a storage capacity of 269 acre-feet. Its uncontrolled spillway and outlet gates ensure efficient water management, with a low hazard potential and a moderate risk assessment rating.
Despite being privately owned, the dam is subject to state jurisdiction and inspection, with a periodic assessment frequency of 5 years. The dam's condition remains unrated, but its risk management measures are deemed sufficient for the moderate risk level it poses. With a drainage area of 235 square miles and a maximum discharge capacity of 269 cubic feet per second, Chickasaw Lake Dam plays a crucial role in maintaining water resources and climate stability in the region.
Although lacking federal regulatory oversight, Chickasaw Lake Dam stands as a testament to responsible dam management and the importance of sustainable land use practices. Its presence not only enhances the recreational opportunities in the area but also underscores the need for continued vigilance and maintenance to ensure the safety and integrity of water resources for both present and future generations.
Plan around the weather
Same NOAA / yr.no feed Snoflo's iOS app uses. Watch the precipitation column on the meteogram -- rain on the basin upstream typically lifts inflow 24-72 hours later.
Next 5 days, hour by hour
Temperature line with weather symbols on top, snow + rain accumulation as columns, humidity as a dotted line.
5-day forecast table
Every 3 hours, broken out across temperature, snow, rain, humidity, and wind. Each cell is colour-coded relative to the column min/max.
| Time | Condition | Temp (°F) | Snow (in) | Rain (in) | Humidity (%) | Wind (mps) | Wind dir |
|---|---|---|---|---|---|---|---|
| Loading detailed forecast… | |||||||
15-day temperature & precipitation
Daily temperatures, snow, and rain projected over the next two weeks.
Nearby streamflow gauges
USGS streamgauges around Chickasaw Lake Dam -- inflows here typically show up in storage 24-72 hours later.
| Streamgauge | Discharge | View |
|---|---|---|
| Etowah River At Canton | 396 cfs | → |
| Talking Rock Creek Near Hinton | 46 cfs | → |
| Etowah River At Allatoona Dam | 359 cfs | → |
| Two Run Creek Near Kingston | 11 cfs | → |
| Fausett Creek Near Talking Rock | 4 cfs | → |
| Noonday Creek At Shallowford Road | 35 cfs | → |
Make a day of it
Boat launches, lakeside camping, fishing access, and other reservoirs near Chickasaw Lake Dam.
Boat launches
See all →


Campgrounds
See all →


Fishing spots
See all →


River runs
See all →


About Chickasaw Lake Dam
Where does the data for Chickasaw Lake Dam come from?
Structural and regulatory data come from the U.S. Army Corps of Engineers' National Inventory of Dams (NID). Weather forecast comes from NOAA / yr.no -- the same feed Snoflo's iOS app uses.
How often is the report updated?
NID structural data refreshes annually as the Corps publishes updated assessments. The weather forecast refreshes throughout the day.
What does the Low hazard rating mean?
The Corps of Engineers' hazard potential classification grades probable consequences if the dam fails: High = probable loss of human life; Significant = no probable loss of human life but possible economic loss / environmental damage; Low = no probable loss of human life, only minor economic / environmental losses. See the Dam Data Reference card below for the full definitions.
What's "% of normal"?
The current storage value compared to the historical average storage on this calendar day. 100% = right on average; values above 100% mean above-normal storage (wet year); values below mean below-normal (dry year or drought).
Can I get alerts when storage crosses a threshold?
Yes -- alerts are managed in the Snoflo iOS app. Favorite this dam, set a threshold, and you'll get a push the moment conditions cross.
Dam data reference
Condition Assessment
- Satisfactory
- No existing or potential dam safety deficiencies are recognized. Acceptable performance is expected under all loading conditions (static, hydrologic, seismic) in accordance with the minimum applicable state or federal regulatory criteria or tolerable risk guidelines.
- Fair
- No existing dam safety deficiencies are recognized for normal operating conditions. Rare or extreme hydrologic and/or seismic events may result in a dam safety deficiency. Risk may be in the range to take further action.
- Poor
- A dam safety deficiency is recognized for normal operating conditions which may realistically occur. Remedial action is necessary. POOR may also be used when uncertainties exist as to critical analysis parameters which identify a potential dam safety deficiency.
- Unsatisfactory
- A dam safety deficiency is recognized that requires immediate or emergency remedial action for problem resolution.
- Not Rated
- The dam has not been inspected, is not under state or federal jurisdiction, or has been inspected but, for whatever reason, has not been rated.
Hazard Potential Classification
- High
- Dams assigned the high hazard potential classification are those where failure or mis-operation will probably cause loss of human life.
- Significant
- Dams assigned the significant hazard potential classification are those dams where failure or mis-operation results in no probable loss of human life but can cause economic loss, environmental damage, disruption of lifeline facilities, or impact other concerns. Significant hazard potential classification dams are often located in predominantly rural or agricultural areas but could be in areas with population and significant infrastructure.
- Low
- Dams assigned the low hazard potential classification are those where failure or mis-operation results in no probable loss of human life and low economic and/or environmental losses. Losses are principally limited to the owner's property.
- Undetermined
- Dams for which a downstream hazard potential has not been designated or is not provided.