Willow Lake Dam Dam

Willow Lake Dam
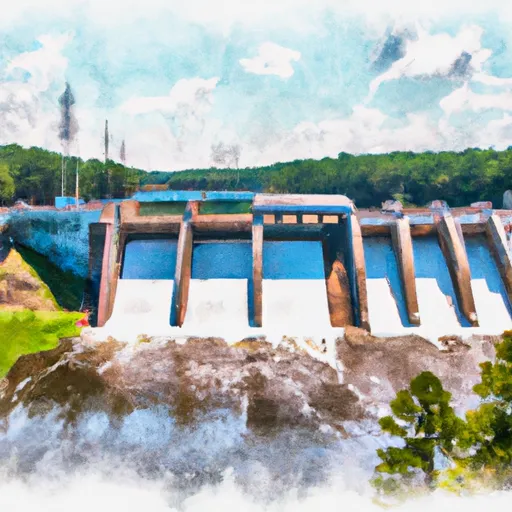
Willow Lake Dam, also known as Horse Shoe Bend Lake Dam, is a private dam located in Roswell, Georgia. Built in 1974 by Urban Engineers, this earth dam stands at a height of 50.5 feet and serves primarily for recreation purposes. With a storage capacity of 676 acre-feet and a drainage area of 225 acres, the dam is a popular spot for outdoor enthusiasts looking to enjoy the 17-acre surface area of Willow Lake.
Despite its recreational value, Willow Lake Dam poses a high hazard potential due to its poor condition assessment. The dam's spillway is uncontrolled, and its outlet gates are also uncontrolled, raising concerns about its ability to manage water flow effectively. The dam is under the jurisdiction of the Georgia Safe Dams Program and undergoes regular inspections, with the last assessment conducted in January 2020. While its risk assessment is moderate, the dam's condition and hazard potential call for careful monitoring and management measures to ensure public safety and environmental protection in the area.
Overall, Willow Lake Dam stands as a significant structure in Fulton County, Georgia, offering recreational opportunities while also presenting challenges in terms of its condition and hazard potential. As climate change continues to impact water resources and infrastructure, it is crucial for dam operators and regulators to prioritize the maintenance and safety of structures like Willow Lake Dam to mitigate risks and ensure sustainable water management practices in the region.
Plan around the weather
Same NOAA / yr.no feed Snoflo's iOS app uses. Watch the precipitation column on the meteogram -- rain on the basin upstream typically lifts inflow 24-72 hours later.
Next 5 days, hour by hour
Temperature line with weather symbols on top, snow + rain accumulation as columns, humidity as a dotted line.
5-day forecast table
Every 3 hours, broken out across temperature, snow, rain, humidity, and wind. Each cell is colour-coded relative to the column min/max.
| Time | Condition | Temp (°F) | Snow (in) | Rain (in) | Humidity (%) | Wind (mps) | Wind dir |
|---|---|---|---|---|---|---|---|
| Loading detailed forecast… | |||||||
15-day temperature & precipitation
Daily temperatures, snow, and rain projected over the next two weeks.
Nearby streamflow gauges
USGS streamgauges around Willow Lake Dam -- inflows here typically show up in storage 24-72 hours later.
| Streamgauge | Discharge | View |
|---|---|---|
| Chattahoochee River Above Roswell | 1,410 cfs | → |
| Crooked Creek Near Norcross | 37 cfs | → |
| Big Creek Near Alpharetta | 298 cfs | → |
| Chattahoochee River Near Norcross | 2,740 cfs | → |
| Chattahoochee River Below Morgan Falls Dam | 2,900 cfs | → |
| N.F. Peachtree Creek At Graves Rd | 0 cfs | → |


About Willow Lake Dam
Where does the data for Willow Lake Dam come from?
Structural and regulatory data come from the U.S. Army Corps of Engineers' National Inventory of Dams (NID). Weather forecast comes from NOAA / yr.no -- the same feed Snoflo's iOS app uses.
How often is the report updated?
NID structural data refreshes annually as the Corps publishes updated assessments. The weather forecast refreshes throughout the day.
What does the High hazard rating mean?
The Corps of Engineers' hazard potential classification grades probable consequences if the dam fails: High = probable loss of human life; Significant = no probable loss of human life but possible economic loss / environmental damage; Low = no probable loss of human life, only minor economic / environmental losses. See the Dam Data Reference card below for the full definitions.
What's "% of normal"?
The current storage value compared to the historical average storage on this calendar day. 100% = right on average; values above 100% mean above-normal storage (wet year); values below mean below-normal (dry year or drought).
Can I get alerts when storage crosses a threshold?
Yes -- alerts are managed in the Snoflo iOS app. Favorite this dam, set a threshold, and you'll get a push the moment conditions cross.
Dam data reference
Condition Assessment
- Satisfactory
- No existing or potential dam safety deficiencies are recognized. Acceptable performance is expected under all loading conditions (static, hydrologic, seismic) in accordance with the minimum applicable state or federal regulatory criteria or tolerable risk guidelines.
- Fair
- No existing dam safety deficiencies are recognized for normal operating conditions. Rare or extreme hydrologic and/or seismic events may result in a dam safety deficiency. Risk may be in the range to take further action.
- Poor
- A dam safety deficiency is recognized for normal operating conditions which may realistically occur. Remedial action is necessary. POOR may also be used when uncertainties exist as to critical analysis parameters which identify a potential dam safety deficiency.
- Unsatisfactory
- A dam safety deficiency is recognized that requires immediate or emergency remedial action for problem resolution.
- Not Rated
- The dam has not been inspected, is not under state or federal jurisdiction, or has been inspected but, for whatever reason, has not been rated.
Hazard Potential Classification
- High
- Dams assigned the high hazard potential classification are those where failure or mis-operation will probably cause loss of human life.
- Significant
- Dams assigned the significant hazard potential classification are those dams where failure or mis-operation results in no probable loss of human life but can cause economic loss, environmental damage, disruption of lifeline facilities, or impact other concerns. Significant hazard potential classification dams are often located in predominantly rural or agricultural areas but could be in areas with population and significant infrastructure.
- Low
- Dams assigned the low hazard potential classification are those where failure or mis-operation results in no probable loss of human life and low economic and/or environmental losses. Losses are principally limited to the owner's property.
- Undetermined
- Dams for which a downstream hazard potential has not been designated or is not provided.