Bean Blossom Dam Dam

Bean Blossom Dam
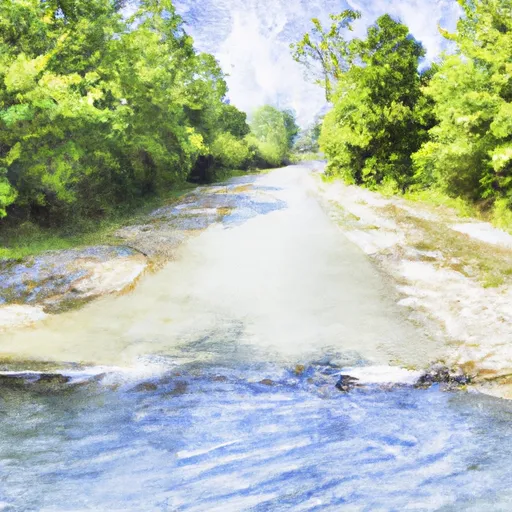
Bean Blossom Dam, located in Monroe County, Indiana, is a state-owned structure primarily used for recreation. Completed in 1945, this earth dam stands at 21 feet high and spans 298 feet in length, with a storage capacity of 221 acre-feet. Despite being classified as low hazard potential, the dam's condition assessment remains unrated, with the last inspection conducted in 1993.
The dam, situated along the Bean Blossom Creek, has a normal storage capacity of 57 acre-feet and a drainage area of 1.67 square miles. Its maximum discharge capability is reported to be 567 cubic feet per second, emphasizing its role in flood control and water resource management in the region. While lacking detailed information on spillway type and emergency action plans, the dam continues to serve as a crucial recreational site for locals and visitors alike.
For water resource and climate enthusiasts, Bean Blossom Dam represents a vital piece of infrastructure in Indiana's water management system. As discussions around dam safety and maintenance continue, the dam's role in providing recreational opportunities and flood control remains essential. With its historical significance and ongoing relevance in the region, Bean Blossom Dam serves as a focal point for understanding the intersection of water resources, infrastructure development, and environmental stewardship in the state.
Plan around the weather
Same NOAA / yr.no feed Snoflo's iOS app uses. Watch the precipitation column on the meteogram -- rain on the basin upstream typically lifts inflow 24-72 hours later.
Next 5 days, hour by hour
Temperature line with weather symbols on top, snow + rain accumulation as columns, humidity as a dotted line.
5-day forecast table
Every 3 hours, broken out across temperature, snow, rain, humidity, and wind. Each cell is colour-coded relative to the column min/max.
| Time | Condition | Temp (°F) | Snow (in) | Rain (in) | Humidity (%) | Wind (mps) | Wind dir |
|---|---|---|---|---|---|---|---|
| Loading detailed forecast… | |||||||
15-day temperature & precipitation
Daily temperatures, snow, and rain projected over the next two weeks.
Nearby streamflow gauges
USGS streamgauges around Bean Blossom Dam -- inflows here typically show up in storage 24-72 hours later.
| Streamgauge | Discharge | View |
|---|---|---|
| North Fork Salt Creek At Nashville | 17 cfs | → |
| White River Near Centerton | 1,650 cfs | → |
| Mill Creek Near Cataract | 25 cfs | → |
| White Lick Creek At Mooresville | 36 cfs | → |
| Sugar Creek Near Edinburgh | 121 cfs | → |
| Driftwood River Near Edinburgh Ind | 466 cfs | → |


About Bean Blossom Dam
Where does the data for Bean Blossom Dam come from?
Structural and regulatory data come from the U.S. Army Corps of Engineers' National Inventory of Dams (NID). Weather forecast comes from NOAA / yr.no -- the same feed Snoflo's iOS app uses.
How often is the report updated?
NID structural data refreshes annually as the Corps publishes updated assessments. The weather forecast refreshes throughout the day.
What does the Low hazard rating mean?
The Corps of Engineers' hazard potential classification grades probable consequences if the dam fails: High = probable loss of human life; Significant = no probable loss of human life but possible economic loss / environmental damage; Low = no probable loss of human life, only minor economic / environmental losses. See the Dam Data Reference card below for the full definitions.
What's "% of normal"?
The current storage value compared to the historical average storage on this calendar day. 100% = right on average; values above 100% mean above-normal storage (wet year); values below mean below-normal (dry year or drought).
Can I get alerts when storage crosses a threshold?
Yes -- alerts are managed in the Snoflo iOS app. Favorite this dam, set a threshold, and you'll get a push the moment conditions cross.
Dam data reference
Condition Assessment
- Satisfactory
- No existing or potential dam safety deficiencies are recognized. Acceptable performance is expected under all loading conditions (static, hydrologic, seismic) in accordance with the minimum applicable state or federal regulatory criteria or tolerable risk guidelines.
- Fair
- No existing dam safety deficiencies are recognized for normal operating conditions. Rare or extreme hydrologic and/or seismic events may result in a dam safety deficiency. Risk may be in the range to take further action.
- Poor
- A dam safety deficiency is recognized for normal operating conditions which may realistically occur. Remedial action is necessary. POOR may also be used when uncertainties exist as to critical analysis parameters which identify a potential dam safety deficiency.
- Unsatisfactory
- A dam safety deficiency is recognized that requires immediate or emergency remedial action for problem resolution.
- Not Rated
- The dam has not been inspected, is not under state or federal jurisdiction, or has been inspected but, for whatever reason, has not been rated.
Hazard Potential Classification
- High
- Dams assigned the high hazard potential classification are those where failure or mis-operation will probably cause loss of human life.
- Significant
- Dams assigned the significant hazard potential classification are those dams where failure or mis-operation results in no probable loss of human life but can cause economic loss, environmental damage, disruption of lifeline facilities, or impact other concerns. Significant hazard potential classification dams are often located in predominantly rural or agricultural areas but could be in areas with population and significant infrastructure.
- Low
- Dams assigned the low hazard potential classification are those where failure or mis-operation results in no probable loss of human life and low economic and/or environmental losses. Losses are principally limited to the owner's property.
- Undetermined
- Dams for which a downstream hazard potential has not been designated or is not provided.