Porter Lake Dam

Porter Lake Dam
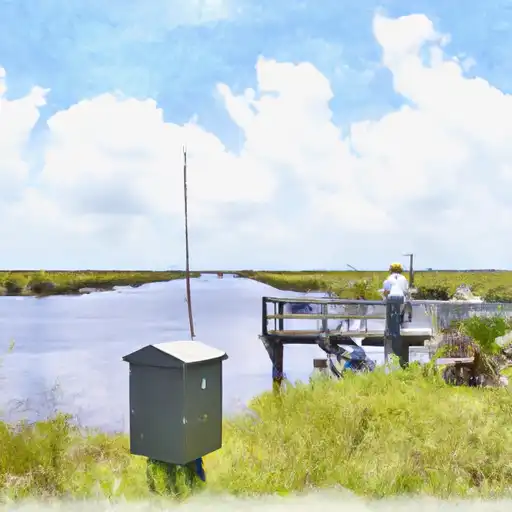
Porter Lake Dam, located in Port Gibson, Mississippi, is a privately owned structure designed by the USDA NRCS in 1966 for recreational purposes. Standing at a height of 18 feet, the earth dam has a storage capacity of 132 acre-feet and is primarily used for recreational activities. The dam is regulated by the Mississippi Department of Environmental Quality and is inspected, permitted, and enforced by state agencies to ensure its safety and compliance with regulations.
Despite being classified as having a low hazard potential and a moderate risk level, Porter Lake Dam has not been rated for its condition. It features an uncontrolled spillway and outlet gates, serving the surrounding area along TR- Barland Creek. While the dam has not undergone recent inspections or assessments, it remains under state jurisdiction and is subject to state regulatory oversight. The structure plays a vital role in providing recreational opportunities and managing water resources within the Claiborne County area.
For water resource and climate enthusiasts, Porter Lake Dam stands as a notable earth dam in Mississippi with a rich history dating back to the 1960s. While its condition assessment is pending, the dam continues to serve its primary purpose of recreation for the local community. With its unique design and location, the dam contributes to the conservation and management of water resources in the region, highlighting the importance of infrastructure like Porter Lake Dam in sustaining environmental and recreational needs.
Plan around the weather
Same NOAA / yr.no feed Snoflo's iOS app uses. Watch the precipitation column on the meteogram -- rain on the basin upstream typically lifts inflow 24-72 hours later.
Next 5 days, hour by hour
Temperature line with weather symbols on top, snow + rain accumulation as columns, humidity as a dotted line.
5-day forecast table
Every 3 hours, broken out across temperature, snow, rain, humidity, and wind. Each cell is colour-coded relative to the column min/max.
| Time | Condition | Temp (°F) | Snow (in) | Rain (in) | Humidity (%) | Wind (mps) | Wind dir |
|---|---|---|---|---|---|---|---|
| Loading detailed forecast… | |||||||
15-day temperature & precipitation
Daily temperatures, snow, and rain projected over the next two weeks.
Nearby streamflow gauges
USGS streamgauges around Porter Lake Dam -- inflows here typically show up in storage 24-72 hours later.
| Streamgauge | Discharge | View |
|---|---|---|
| Bayou Pierre Nr Willows | 71 cfs | → |
| Homochitto River At Eddiceton | 47 cfs | → |
| Mississippi River At Vicksburg | 537,000 cfs | → |
| Big Black River Nr Bovina | 617 cfs | → |
| Pearl River Nr Rockport | 884 cfs | → |
| Homochitto River At Rosetta | 346 cfs | → |


About Porter Lake Dam
Where does the data for Porter Lake Dam come from?
Structural and regulatory data come from the U.S. Army Corps of Engineers' National Inventory of Dams (NID). Weather forecast comes from NOAA / yr.no -- the same feed Snoflo's iOS app uses.
How often is the report updated?
NID structural data refreshes annually as the Corps publishes updated assessments. The weather forecast refreshes throughout the day.
What does the Low hazard rating mean?
The Corps of Engineers' hazard potential classification grades probable consequences if the dam fails: High = probable loss of human life; Significant = no probable loss of human life but possible economic loss / environmental damage; Low = no probable loss of human life, only minor economic / environmental losses. See the Dam Data Reference card below for the full definitions.
What's "% of normal"?
The current storage value compared to the historical average storage on this calendar day. 100% = right on average; values above 100% mean above-normal storage (wet year); values below mean below-normal (dry year or drought).
Can I get alerts when storage crosses a threshold?
Yes -- alerts are managed in the Snoflo iOS app. Favorite this dam, set a threshold, and you'll get a push the moment conditions cross.
Dam data reference
Condition Assessment
- Satisfactory
- No existing or potential dam safety deficiencies are recognized. Acceptable performance is expected under all loading conditions (static, hydrologic, seismic) in accordance with the minimum applicable state or federal regulatory criteria or tolerable risk guidelines.
- Fair
- No existing dam safety deficiencies are recognized for normal operating conditions. Rare or extreme hydrologic and/or seismic events may result in a dam safety deficiency. Risk may be in the range to take further action.
- Poor
- A dam safety deficiency is recognized for normal operating conditions which may realistically occur. Remedial action is necessary. POOR may also be used when uncertainties exist as to critical analysis parameters which identify a potential dam safety deficiency.
- Unsatisfactory
- A dam safety deficiency is recognized that requires immediate or emergency remedial action for problem resolution.
- Not Rated
- The dam has not been inspected, is not under state or federal jurisdiction, or has been inspected but, for whatever reason, has not been rated.
Hazard Potential Classification
- High
- Dams assigned the high hazard potential classification are those where failure or mis-operation will probably cause loss of human life.
- Significant
- Dams assigned the significant hazard potential classification are those dams where failure or mis-operation results in no probable loss of human life but can cause economic loss, environmental damage, disruption of lifeline facilities, or impact other concerns. Significant hazard potential classification dams are often located in predominantly rural or agricultural areas but could be in areas with population and significant infrastructure.
- Low
- Dams assigned the low hazard potential classification are those where failure or mis-operation results in no probable loss of human life and low economic and/or environmental losses. Losses are principally limited to the owner's property.
- Undetermined
- Dams for which a downstream hazard potential has not been designated or is not provided.