Verida Marchette Pond Dam

Verida Marchette Pond Dam
Verida Marchette Pond Dam, located in Florence, South Carolina, is a private dam constructed in 1920 primarily for recreation purposes. With a height of 11 feet and a length of 450 feet, the dam stands as a crucial structure along Jeffries Creek, providing a storage capacity of 184 acre-feet. Despite its low hazard potential, the dam is regulated by the South Carolina Department of Health and Environmental Control, ensuring ongoing inspections and enforcement for public safety.
The dam features an earth core type with a buttress foundation, and a controlled spillway system to manage water flow. Its surface area covers 23 acres, serving as a popular recreational spot for locals and visitors alike. The risk assessment for the dam indicates a very high risk level, requiring careful monitoring and potential risk management measures to prevent any potential hazards. Although the condition assessment remains unrated as of the last inspection in 2017, the dam's importance in water resource management and climate resilience cannot be understated.
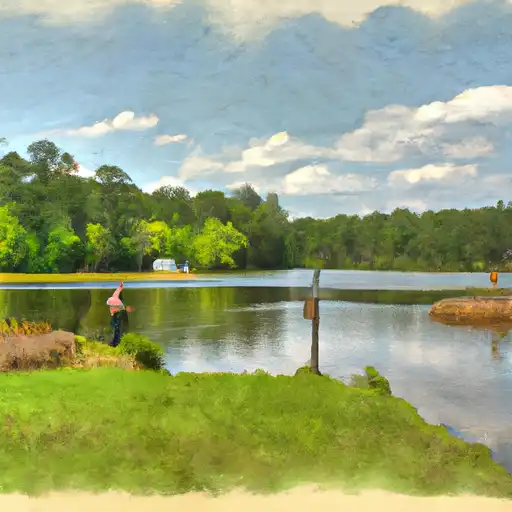
Verida Marchette Pond Dam, nestled within the lush surroundings of Jeffries Creek, stands as a historic landmark in South Carolina's water infrastructure. With its serene waters and picturesque setting, the dam continues to attract outdoor enthusiasts and nature lovers seeking solace and relaxation. As climate change impacts water resources worldwide, the preservation and maintenance of dams like Verida Marchette Pond Dam are essential to ensure sustainable water management practices for future generations.
Inside the reservoir
The real shoreline of this water body, with a depth model scaled so the basin holds exactly its recorded storage. Drag to orbit, scroll to zoom, and use the slider to drain and refill it. Click anywhere on the basin for the modelled depth there.
How this is built. The shoreline is the National Hydrography
Dataset polygon for this water body (“Muldrow Mill Pond”),
matched to the dam by proximity and confirmed by comparing its area with the
National Inventory of Dams surface area (agreement 0.815×).
Depth is modelled, not surveyed: the basin is shaped by distance from
shore — deep in open water, shallow in the bays — and scaled so its
volume equals the recorded storage. No national bathymetric survey exists for
US reservoirs. Treat the shoreline, area and volume as measured, and the depth
distribution as an informed approximation.
Above normal pool, water is shown rising within the normal-pool
shoreline. Where it would actually spread depends on the surrounding
terrain, which is not modelled here — a reservoir in a steep canyon barely
widens, one on flat ground can spread a long way. This is a depth and volume
figure, not an inundation map. Official inundation mapping for a dam
comes from its Emergency Action Plan.
Plan around the weather
Same NOAA / yr.no feed Snoflo's iOS app uses. Watch the precipitation column on the meteogram -- rain on the basin upstream typically lifts inflow 24-72 hours later.
Next 5 days, hour by hour
Temperature line with weather symbols on top, snow + rain accumulation as columns, humidity as a dotted line.
5-day forecast table
Every 3 hours, broken out across temperature, snow, rain, humidity, and wind. Each cell is colour-coded relative to the column min/max.
| Time | Condition | Temp (°F) | Snow (in) | Rain (in) | Humidity (%) | Wind (mps) | Wind dir |
|---|---|---|---|---|---|---|---|
| Loading detailed forecast… | |||||||
15-day temperature & precipitation
Daily temperatures, snow, and rain projected over the next two weeks.
Nearby streamflow gauges
USGS streamgauges around Verida Marchette Pond Dam -- inflows here typically show up in storage 24-72 hours later.
| Streamgauge | Discharge | View |
|---|---|---|
| Black Creek Near Quinby | 134 cfs | → |
| Lynches River At Effingham | 204 cfs | → |
| Lynches River Near Bishopville | 167 cfs | → |
| Pee Dee River At Peedee | 3,040 cfs | → |
| Pee Dee River Below Pee Dee | 3,180 cfs | → |
| Black Creek Near Hartsville | 72 cfs | → |


About Verida Marchette Pond Dam
Where does the data for Verida Marchette Pond Dam come from?
Structural and regulatory data come from the U.S. Army Corps of Engineers' National Inventory of Dams (NID). Weather forecast comes from NOAA / yr.no -- the same feed Snoflo's iOS app uses.
How often is the report updated?
NID structural data refreshes annually as the Corps publishes updated assessments. The weather forecast refreshes throughout the day.
What does the Low hazard rating mean?
The Corps of Engineers' hazard potential classification grades probable consequences if the dam fails: High = probable loss of human life; Significant = no probable loss of human life but possible economic loss / environmental damage; Low = no probable loss of human life, only minor economic / environmental losses. See the Dam Data Reference card below for the full definitions.
What's "% of normal"?
The current storage value compared to the historical average storage on this calendar day. 100% = right on average; values above 100% mean above-normal storage (wet year); values below mean below-normal (dry year or drought).
Can I get alerts when storage crosses a threshold?
Yes -- alerts are managed in the Snoflo iOS app. Favorite this dam, set a threshold, and you'll get a push the moment conditions cross.
Dam data reference
Condition Assessment
- Satisfactory
- No existing or potential dam safety deficiencies are recognized. Acceptable performance is expected under all loading conditions (static, hydrologic, seismic) in accordance with the minimum applicable state or federal regulatory criteria or tolerable risk guidelines.
- Fair
- No existing dam safety deficiencies are recognized for normal operating conditions. Rare or extreme hydrologic and/or seismic events may result in a dam safety deficiency. Risk may be in the range to take further action.
- Poor
- A dam safety deficiency is recognized for normal operating conditions which may realistically occur. Remedial action is necessary. POOR may also be used when uncertainties exist as to critical analysis parameters which identify a potential dam safety deficiency.
- Unsatisfactory
- A dam safety deficiency is recognized that requires immediate or emergency remedial action for problem resolution.
- Not Rated
- The dam has not been inspected, is not under state or federal jurisdiction, or has been inspected but, for whatever reason, has not been rated.
Hazard Potential Classification
- High
- Dams assigned the high hazard potential classification are those where failure or mis-operation will probably cause loss of human life.
- Significant
- Dams assigned the significant hazard potential classification are those dams where failure or mis-operation results in no probable loss of human life but can cause economic loss, environmental damage, disruption of lifeline facilities, or impact other concerns. Significant hazard potential classification dams are often located in predominantly rural or agricultural areas but could be in areas with population and significant infrastructure.
- Low
- Dams assigned the low hazard potential classification are those where failure or mis-operation results in no probable loss of human life and low economic and/or environmental losses. Losses are principally limited to the owner's property.
- Undetermined
- Dams for which a downstream hazard potential has not been designated or is not provided.