Cedar Dam

Cedar Dam
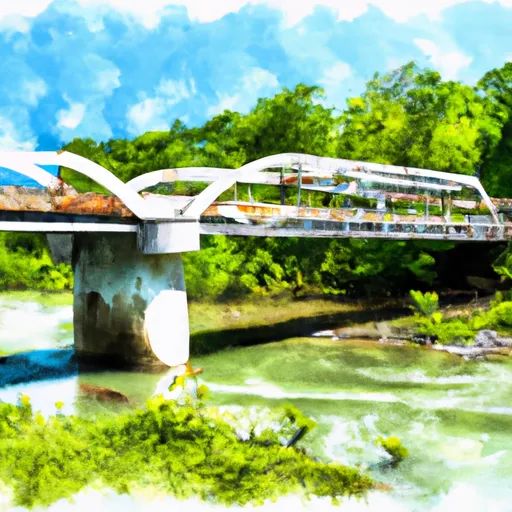
Cedar Dam, also known as Cedar Lake or Haley Creek Dam, is a Federal-owned structure designed by the Tennessee Valley Authority (TVA) in Tennessee. Completed in 1963, the dam serves primarily for flood risk reduction along the Haley Creek, with additional purposes including recreation. The dam is an earth-type structure with a height of 27 feet and a length of 750 feet, holding a normal storage capacity of 870 acre-feet and a maximum storage of 1090 acre-feet.
Situated in Henderson County, Tennessee, Cedar Dam poses a high hazard potential and has a moderate risk assessment. The dam features an uncontrolled spillway with a width of 200 feet and multiple outlet gates including other controlled mechanisms and slide gates. The inspection frequency for Cedar Dam is every 2 years, with the last inspection conducted in December 2020. While the condition assessment is not available, the Emergency Action Plan (EAP) status and risk management measures for the dam are also currently undefined.
Water resource and climate enthusiasts interested in Cedar Dam can observe its critical role in flood risk reduction along the Haley Creek in Tennessee. Managed by the Tennessee Valley Authority, the dam's design and construction uphold safety standards, although certain aspects such as condition assessment and emergency preparedness require further evaluation. With its important functions and features, Cedar Dam stands as a significant structure for both water management and public safety in the region.
Plan around the weather
Same NOAA / yr.no feed Snoflo's iOS app uses. Watch the precipitation column on the meteogram -- rain on the basin upstream typically lifts inflow 24-72 hours later.
Next 5 days, hour by hour
Temperature line with weather symbols on top, snow + rain accumulation as columns, humidity as a dotted line.
5-day forecast table
Every 3 hours, broken out across temperature, snow, rain, humidity, and wind. Each cell is colour-coded relative to the column min/max.
| Time | Condition | Temp (°F) | Snow (in) | Rain (in) | Humidity (%) | Wind (mps) | Wind dir |
|---|---|---|---|---|---|---|---|
| Loading detailed forecast… | |||||||
15-day temperature & precipitation
Daily temperatures, snow, and rain projected over the next two weeks.
Nearby streamflow gauges
USGS streamgauges around Cedar Dam -- inflows here typically show up in storage 24-72 hours later.
| Streamgauge | Discharge | View |
|---|---|---|
| Big Sandy River At Bruceton | 74 cfs | → |
| Crooked Creek Near Huntingdon | 38 cfs | → |
| Cypress Creek At Camden | 10 cfs | → |
| Buffalo River Near Flat Woods | 701 cfs | → |
| Middle Fork Forked Deer River Near Fairview | 81 cfs | → |
| Buffalo River Below Lobelville | 1,190 cfs | → |
Make a day of it
Boat launches, lakeside camping, fishing access, and other reservoirs near Cedar Dam.
Boat launches
See all →


About Cedar Dam
Where does the data for Cedar Dam come from?
Structural and regulatory data come from the U.S. Army Corps of Engineers' National Inventory of Dams (NID). Weather forecast comes from NOAA / yr.no -- the same feed Snoflo's iOS app uses.
How often is the report updated?
NID structural data refreshes annually as the Corps publishes updated assessments. The weather forecast refreshes throughout the day.
What does the High hazard rating mean?
The Corps of Engineers' hazard potential classification grades probable consequences if the dam fails: High = probable loss of human life; Significant = no probable loss of human life but possible economic loss / environmental damage; Low = no probable loss of human life, only minor economic / environmental losses. See the Dam Data Reference card below for the full definitions.
What's "% of normal"?
The current storage value compared to the historical average storage on this calendar day. 100% = right on average; values above 100% mean above-normal storage (wet year); values below mean below-normal (dry year or drought).
Can I get alerts when storage crosses a threshold?
Yes -- alerts are managed in the Snoflo iOS app. Favorite this dam, set a threshold, and you'll get a push the moment conditions cross.
Dam data reference
Condition Assessment
- Satisfactory
- No existing or potential dam safety deficiencies are recognized. Acceptable performance is expected under all loading conditions (static, hydrologic, seismic) in accordance with the minimum applicable state or federal regulatory criteria or tolerable risk guidelines.
- Fair
- No existing dam safety deficiencies are recognized for normal operating conditions. Rare or extreme hydrologic and/or seismic events may result in a dam safety deficiency. Risk may be in the range to take further action.
- Poor
- A dam safety deficiency is recognized for normal operating conditions which may realistically occur. Remedial action is necessary. POOR may also be used when uncertainties exist as to critical analysis parameters which identify a potential dam safety deficiency.
- Unsatisfactory
- A dam safety deficiency is recognized that requires immediate or emergency remedial action for problem resolution.
- Not Rated
- The dam has not been inspected, is not under state or federal jurisdiction, or has been inspected but, for whatever reason, has not been rated.
Hazard Potential Classification
- High
- Dams assigned the high hazard potential classification are those where failure or mis-operation will probably cause loss of human life.
- Significant
- Dams assigned the significant hazard potential classification are those dams where failure or mis-operation results in no probable loss of human life but can cause economic loss, environmental damage, disruption of lifeline facilities, or impact other concerns. Significant hazard potential classification dams are often located in predominantly rural or agricultural areas but could be in areas with population and significant infrastructure.
- Low
- Dams assigned the low hazard potential classification are those where failure or mis-operation results in no probable loss of human life and low economic and/or environmental losses. Losses are principally limited to the owner's property.
- Undetermined
- Dams for which a downstream hazard potential has not been designated or is not provided.