Watts Bar Dam

Watts Bar Dam
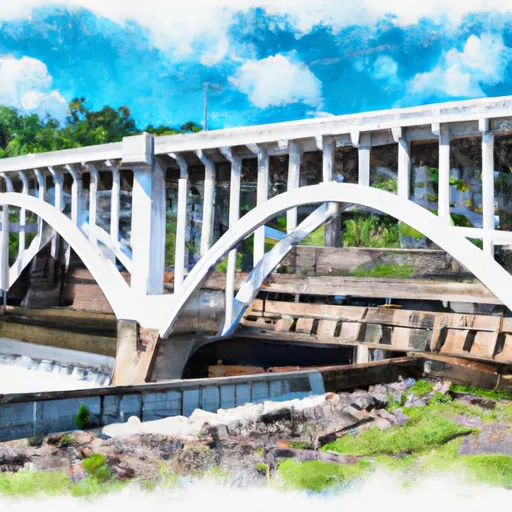
Watts Bar Dam, located in Meigs, Tennessee, along the Tennessee River, is a captivating marvel of engineering with a primary purpose of flood risk reduction. Built in 1942 by the Tennessee Valley Authority (TVA), this concrete dam stands at an impressive height of 118 feet, with a hydraulic height of 136 feet and a structural height of 150 feet. With a storage capacity of over 1.4 million acre-feet, the dam serves as a vital resource for managing water levels and mitigating flood risks in the region.
In addition to flood risk reduction, Watts Bar Dam also serves multiple purposes such as hydroelectric power generation, navigation, and recreation. The dam features a controlled spillway with a width of 800 feet and a single lock that spans 360 feet in length and 60 feet in width. With a high hazard potential and a very high risk assessment rating, the dam's safety and maintenance are overseen by the TVA, ensuring the protection of surrounding communities and the environment.
Despite its age, Watts Bar Dam continues to play a crucial role in water resource management and climate resilience efforts in the region. As a key component of the Tennessee River system, this iconic structure not only provides essential flood control measures but also supports sustainable energy production and recreational activities, showcasing the enduring legacy of TVA's commitment to environmental stewardship and public safety.
Plan around the weather
Same NOAA / yr.no feed Snoflo's iOS app uses. Watch the precipitation column on the meteogram -- rain on the basin upstream typically lifts inflow 24-72 hours later.
Next 5 days, hour by hour
Temperature line with weather symbols on top, snow + rain accumulation as columns, humidity as a dotted line.
5-day forecast table
Every 3 hours, broken out across temperature, snow, rain, humidity, and wind. Each cell is colour-coded relative to the column min/max.
| Time | Condition | Temp (°F) | Snow (in) | Rain (in) | Humidity (%) | Wind (mps) | Wind dir |
|---|---|---|---|---|---|---|---|
| Loading detailed forecast… | |||||||
15-day temperature & precipitation
Daily temperatures, snow, and rain projected over the next two weeks.
Nearby streamflow gauges
USGS streamgauges around Watts Bar Dam -- inflows here typically show up in storage 24-72 hours later.
| Streamgauge | Discharge | View |
|---|---|---|
| Sewee Creek Near Decatur | 59 cfs | → |
| Oostanaula Creek Near Sanford | 36 cfs | → |
| Hiwassee River At Charleston | 10,400 cfs | → |
| Daddys Creek Near Hebbertsburg | 33 cfs | → |
| Emory River At Oakdale | 199 cfs | → |
| Obed River Near Lancing | 0 cfs | → |
Make a day of it
Boat launches, lakeside camping, fishing access, and other reservoirs near Watts Bar Dam.
Boat launches
See all →


Campgrounds
See all →


Fishing spots
See all →


River runs
See all →


About Watts Bar Dam
Where does the data for Watts Bar Dam come from?
Structural and regulatory data come from the U.S. Army Corps of Engineers' National Inventory of Dams (NID). Weather forecast comes from NOAA / yr.no -- the same feed Snoflo's iOS app uses.
How often is the report updated?
NID structural data refreshes annually as the Corps publishes updated assessments. The weather forecast refreshes throughout the day.
What does the High hazard rating mean?
The Corps of Engineers' hazard potential classification grades probable consequences if the dam fails: High = probable loss of human life; Significant = no probable loss of human life but possible economic loss / environmental damage; Low = no probable loss of human life, only minor economic / environmental losses. See the Dam Data Reference card below for the full definitions.
What's "% of normal"?
The current storage value compared to the historical average storage on this calendar day. 100% = right on average; values above 100% mean above-normal storage (wet year); values below mean below-normal (dry year or drought).
Can I get alerts when storage crosses a threshold?
Yes -- alerts are managed in the Snoflo iOS app. Favorite this dam, set a threshold, and you'll get a push the moment conditions cross.
Dam data reference
Condition Assessment
- Satisfactory
- No existing or potential dam safety deficiencies are recognized. Acceptable performance is expected under all loading conditions (static, hydrologic, seismic) in accordance with the minimum applicable state or federal regulatory criteria or tolerable risk guidelines.
- Fair
- No existing dam safety deficiencies are recognized for normal operating conditions. Rare or extreme hydrologic and/or seismic events may result in a dam safety deficiency. Risk may be in the range to take further action.
- Poor
- A dam safety deficiency is recognized for normal operating conditions which may realistically occur. Remedial action is necessary. POOR may also be used when uncertainties exist as to critical analysis parameters which identify a potential dam safety deficiency.
- Unsatisfactory
- A dam safety deficiency is recognized that requires immediate or emergency remedial action for problem resolution.
- Not Rated
- The dam has not been inspected, is not under state or federal jurisdiction, or has been inspected but, for whatever reason, has not been rated.
Hazard Potential Classification
- High
- Dams assigned the high hazard potential classification are those where failure or mis-operation will probably cause loss of human life.
- Significant
- Dams assigned the significant hazard potential classification are those dams where failure or mis-operation results in no probable loss of human life but can cause economic loss, environmental damage, disruption of lifeline facilities, or impact other concerns. Significant hazard potential classification dams are often located in predominantly rural or agricultural areas but could be in areas with population and significant infrastructure.
- Low
- Dams assigned the low hazard potential classification are those where failure or mis-operation results in no probable loss of human life and low economic and/or environmental losses. Losses are principally limited to the owner's property.
- Undetermined
- Dams for which a downstream hazard potential has not been designated or is not provided.