Alba Lakeshores Dam

Alba Lakeshores Dam
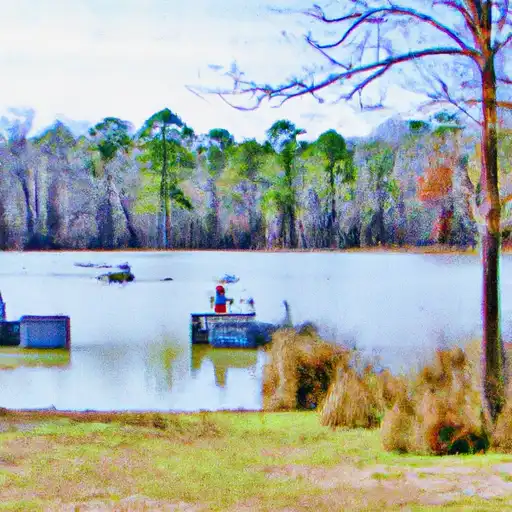
Alba Lakeshores Dam, located in Wood County, Texas, was completed in 1958 for the primary purpose of recreation. The dam stands at a height of 14 feet and stretches 765 feet in length, with a normal storage capacity of 54 acre-feet. The dam, classified as an earth dam with a buttress core type, overlooks the TR-NO. 5 Branch river or stream, providing a picturesque setting for outdoor enthusiasts and nature lovers alike.
Managed by a private entity, Alba Lakeshores Dam has undergone modifications in 1990 and features an uncontrolled spillway with a width of 65 feet. The dam has a moderate risk assessment rating and has not been rated for its condition assessment. Despite not being state-regulated or under federal ownership, the dam is subject to state permitting and inspection requirements. The dam's emergency action plan and risk management measures are not fully disclosed, but the dam is equipped with uncontrolled and valve outlet gates.
Alba Lakeshores Dam serves as a vital resource for recreational activities in the area, offering a serene escape for visitors to enjoy fishing, boating, and other water-based activities. While the dam has not been inspected since 2004, its strategic location and design uphold its functionality and importance in the community. Water resource and climate enthusiasts can appreciate the significance of Alba Lakeshores Dam as a key feature in the natural landscape of Wood County, Texas.
Plan around the weather
Same NOAA / yr.no feed Snoflo's iOS app uses. Watch the precipitation column on the meteogram -- rain on the basin upstream typically lifts inflow 24-72 hours later.
Next 5 days, hour by hour
Temperature line with weather symbols on top, snow + rain accumulation as columns, humidity as a dotted line.
5-day forecast table
Every 3 hours, broken out across temperature, snow, rain, humidity, and wind. Each cell is colour-coded relative to the column min/max.
| Time | Condition | Temp (°F) | Snow (in) | Rain (in) | Humidity (%) | Wind (mps) | Wind dir |
|---|---|---|---|---|---|---|---|
| Loading detailed forecast… | |||||||
15-day temperature & precipitation
Daily temperatures, snow, and rain projected over the next two weeks.
Nearby streamflow gauges
USGS streamgauges around Alba Lakeshores Dam -- inflows here typically show up in storage 24-72 hours later.
| Streamgauge | Discharge | View |
|---|---|---|
| Lake Fork Ck Nr Quitman | 76 cfs | → |
| Sabine Rv Nr Mineola | 10 cfs | → |
| Sabine Rv Nr Wills Point | 8 cfs | → |
| Sabine Rv Nr Hawkins | 60 cfs | → |
| Cedar Ck Nr Kemp | · | → |
| Big Sandy Ck Nr Big Sandy | 8 cfs | → |


About Alba Lakeshores Dam
Where does the data for Alba Lakeshores Dam come from?
Structural and regulatory data come from the U.S. Army Corps of Engineers' National Inventory of Dams (NID). Weather forecast comes from NOAA / yr.no -- the same feed Snoflo's iOS app uses.
How often is the report updated?
NID structural data refreshes annually as the Corps publishes updated assessments. The weather forecast refreshes throughout the day.
What does the Not Available hazard rating mean?
The Corps of Engineers' hazard potential classification grades probable consequences if the dam fails: High = probable loss of human life; Significant = no probable loss of human life but possible economic loss / environmental damage; Low = no probable loss of human life, only minor economic / environmental losses. See the Dam Data Reference card below for the full definitions.
What's "% of normal"?
The current storage value compared to the historical average storage on this calendar day. 100% = right on average; values above 100% mean above-normal storage (wet year); values below mean below-normal (dry year or drought).
Can I get alerts when storage crosses a threshold?
Yes -- alerts are managed in the Snoflo iOS app. Favorite this dam, set a threshold, and you'll get a push the moment conditions cross.
Dam data reference
Condition Assessment
- Satisfactory
- No existing or potential dam safety deficiencies are recognized. Acceptable performance is expected under all loading conditions (static, hydrologic, seismic) in accordance with the minimum applicable state or federal regulatory criteria or tolerable risk guidelines.
- Fair
- No existing dam safety deficiencies are recognized for normal operating conditions. Rare or extreme hydrologic and/or seismic events may result in a dam safety deficiency. Risk may be in the range to take further action.
- Poor
- A dam safety deficiency is recognized for normal operating conditions which may realistically occur. Remedial action is necessary. POOR may also be used when uncertainties exist as to critical analysis parameters which identify a potential dam safety deficiency.
- Unsatisfactory
- A dam safety deficiency is recognized that requires immediate or emergency remedial action for problem resolution.
- Not Rated
- The dam has not been inspected, is not under state or federal jurisdiction, or has been inspected but, for whatever reason, has not been rated.
Hazard Potential Classification
- High
- Dams assigned the high hazard potential classification are those where failure or mis-operation will probably cause loss of human life.
- Significant
- Dams assigned the significant hazard potential classification are those dams where failure or mis-operation results in no probable loss of human life but can cause economic loss, environmental damage, disruption of lifeline facilities, or impact other concerns. Significant hazard potential classification dams are often located in predominantly rural or agricultural areas but could be in areas with population and significant infrastructure.
- Low
- Dams assigned the low hazard potential classification are those where failure or mis-operation results in no probable loss of human life and low economic and/or environmental losses. Losses are principally limited to the owner's property.
- Undetermined
- Dams for which a downstream hazard potential has not been designated or is not provided.