Red Fleet Reservoir Reservoir
As of July 20, 2026, Red Fleet Reservoir is holding 8,913 acre-ft of water — 43% of normal storage for this date. Storage data refreshed throughout the day.

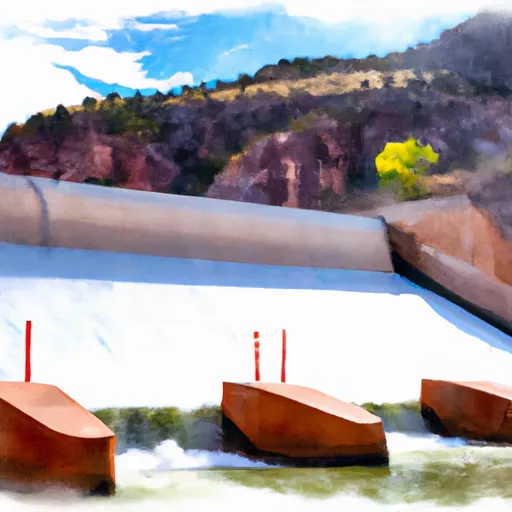
Red Fleet Reservoir
Red Fleet Reservoir is located in northeast Utah and was constructed in 1973. The reservoir is fed by the Green River and is a primary water source for the Uintah Basin. The hydrology of the reservoir relies heavily on snowpack and surface flow from the surrounding mountains. The snowpack is typically heaviest from January through March, and the surface flow is highest during spring runoff from April through July. The reservoir provides water for agricultural uses and also serves as a popular recreation area for camping, boating, and fishing. The reservoir is stocked with rainbow trout, and other fish species found in the reservoir include yellow perch and smallmouth bass. The area around the reservoir also offers hiking trails and rock climbing opportunities.
Daily levels at Red Fleet Reservoir
Storage volume, pool elevation, and total release plotted from the operating agency's daily observations.
Storage
acre-ft · code 17
Inflow
cfs · code 29
Pool Elevation
ft · code 49
Total Release
cfs · code 42
Plan around the weather
Same NOAA / yr.no feed Snoflo's iOS app uses. Watch the precipitation column on the meteogram -- rain on the basin upstream typically lifts inflow 24-72 hours later.
Next 5 days, hour by hour
Temperature line with weather symbols on top, snow + rain accumulation as columns, humidity as a dotted line.
5-day forecast table
Every 3 hours, broken out across temperature, snow, rain, humidity, and wind. Each cell is colour-coded relative to the column min/max.
| Time | Condition | Temp (°F) | Snow (in) | Rain (in) | Humidity (%) | Wind (mps) | Wind dir |
|---|---|---|---|---|---|---|---|
| Loading detailed forecast… | |||||||
15-day temperature & precipitation
Daily temperatures, snow, and rain projected over the next two weeks.
Nearby streamflow gauges
USGS streamgauges around Red Fleet Reservoir -- inflows here typically show up in storage 24-72 hours later.
| Streamgauge | Discharge | View |
|---|---|---|
| Big Brush Creek Abv Red Fleet Res | 12 cfs | → |
| Ashley Creek Near Vernal | 56 cfs | → |
| Ashley Cr Abv Sp Nr Vernal Ut | 4 cfs | → |
| Green River Near Jensen | 2,240 cfs | → |
| Green River Near Greendale | 1,730 cfs | → |
| Whiterocks River Near Whiterocks | 166 cfs | → |


About Red Fleet Reservoir
Where does the data for Red Fleet Reservoir come from?
Daily storage, pool elevation, and release rates are sourced from USGS, USBR, and USACE monitoring stations. Weather forecast comes from NOAA / yr.no -- the same feed Snoflo's iOS app uses.
How often is the report updated?
Storage observations are updated daily by the operating agency. The 15-day weather forecast refreshes throughout the day. Snoflo caches and renders the most recent observation -- check the "as of" timestamp on the storage card.
What does the Hazard hazard rating mean?
The Corps of Engineers' hazard potential classification grades probable consequences if the dam fails: High = probable loss of human life; Significant = no probable loss of human life but possible economic loss / environmental damage; Low = no probable loss of human life, only minor economic / environmental losses. See the Dam Data Reference card below for the full definitions.
What's "% of normal"?
The current storage value compared to the historical average storage on this calendar day. 100% = right on average; values above 100% mean above-normal storage (wet year); values below mean below-normal (dry year or drought).
Can I get alerts when storage crosses a threshold?
Yes -- alerts are managed in the Snoflo iOS app. Favorite this reservoir, set a threshold, and you'll get a push the moment conditions cross.