Great Falls Dam

Great Falls
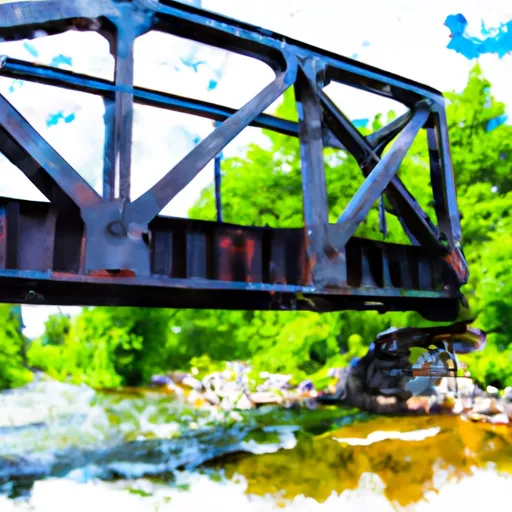
Great Falls, also known as Lyndonville Dam, is a captivating hydroelectric structure located in St Johnsbury Center, Vermont. Completed in 1915, this concrete gravity dam stands at an impressive height of 32 feet and stretches 160 feet in length, harnessing the power of the Passumpsic River to generate electricity. With a storage capacity of 135 acre-feet and a maximum discharge of 4500 cubic feet per second, Great Falls plays a crucial role in the local water resource management system.
Managed by the Federal Energy Regulatory Commission, Great Falls boasts a low hazard potential and a moderate risk rating, making it a reliable source of renewable energy for the region. Despite its age, the dam's condition assessment is not available, highlighting the need for ongoing monitoring and maintenance to ensure its continued safety and functionality. While not currently regulated by the state, Great Falls serves as a testament to the enduring importance of hydroelectric power in the face of climate change and shifting energy needs.
As a key player in Vermont's energy landscape, Great Falls remains a symbol of sustainable development and innovation in the realm of water resource management. Its historic significance, coupled with its modern operational capabilities, positions it as a vital asset for both local communities and environmental enthusiasts alike, showcasing the power of harnessing natural resources for the greater good.
Plan around the weather
Same NOAA / yr.no feed Snoflo's iOS app uses. Watch the precipitation column on the meteogram -- rain on the basin upstream typically lifts inflow 24-72 hours later.
Next 5 days, hour by hour
Temperature line with weather symbols on top, snow + rain accumulation as columns, humidity as a dotted line.
5-day forecast table
Every 3 hours, broken out across temperature, snow, rain, humidity, and wind. Each cell is colour-coded relative to the column min/max.
| Time | Condition | Temp (°F) | Snow (in) | Rain (in) | Humidity (%) | Wind (mps) | Wind dir |
|---|---|---|---|---|---|---|---|
| Loading detailed forecast… | |||||||
15-day temperature & precipitation
Daily temperatures, snow, and rain projected over the next two weeks.
Nearby streamflow gauges
USGS streamgauges around Great Falls -- inflows here typically show up in storage 24-72 hours later.
| Streamgauge | Discharge | View |
|---|---|---|
| Sleepers River (Site W-5) Near St. Johnsbury | 12 cfs | → |
| Pope Brook (Site W-3) Nr. N. Danville | 1 cfs | → |
| Moose River At Victory | 30 cfs | → |
| Passumpsic River At Passumpsic | 274 cfs | → |
| East Branch Passumpsic River Near East Haven | 32 cfs | → |
| Connecticut River Near Dalton | 954 cfs | → |


About Great Falls
Where does the data for Great Falls come from?
Structural and regulatory data come from the U.S. Army Corps of Engineers' National Inventory of Dams (NID). Weather forecast comes from NOAA / yr.no -- the same feed Snoflo's iOS app uses.
How often is the report updated?
NID structural data refreshes annually as the Corps publishes updated assessments. The weather forecast refreshes throughout the day.
What does the Low hazard rating mean?
The Corps of Engineers' hazard potential classification grades probable consequences if the dam fails: High = probable loss of human life; Significant = no probable loss of human life but possible economic loss / environmental damage; Low = no probable loss of human life, only minor economic / environmental losses. See the Dam Data Reference card below for the full definitions.
What's "% of normal"?
The current storage value compared to the historical average storage on this calendar day. 100% = right on average; values above 100% mean above-normal storage (wet year); values below mean below-normal (dry year or drought).
Can I get alerts when storage crosses a threshold?
Yes -- alerts are managed in the Snoflo iOS app. Favorite this dam, set a threshold, and you'll get a push the moment conditions cross.
Dam data reference
Condition Assessment
- Satisfactory
- No existing or potential dam safety deficiencies are recognized. Acceptable performance is expected under all loading conditions (static, hydrologic, seismic) in accordance with the minimum applicable state or federal regulatory criteria or tolerable risk guidelines.
- Fair
- No existing dam safety deficiencies are recognized for normal operating conditions. Rare or extreme hydrologic and/or seismic events may result in a dam safety deficiency. Risk may be in the range to take further action.
- Poor
- A dam safety deficiency is recognized for normal operating conditions which may realistically occur. Remedial action is necessary. POOR may also be used when uncertainties exist as to critical analysis parameters which identify a potential dam safety deficiency.
- Unsatisfactory
- A dam safety deficiency is recognized that requires immediate or emergency remedial action for problem resolution.
- Not Rated
- The dam has not been inspected, is not under state or federal jurisdiction, or has been inspected but, for whatever reason, has not been rated.
Hazard Potential Classification
- High
- Dams assigned the high hazard potential classification are those where failure or mis-operation will probably cause loss of human life.
- Significant
- Dams assigned the significant hazard potential classification are those dams where failure or mis-operation results in no probable loss of human life but can cause economic loss, environmental damage, disruption of lifeline facilities, or impact other concerns. Significant hazard potential classification dams are often located in predominantly rural or agricultural areas but could be in areas with population and significant infrastructure.
- Low
- Dams assigned the low hazard potential classification are those where failure or mis-operation results in no probable loss of human life and low economic and/or environmental losses. Losses are principally limited to the owner's property.
- Undetermined
- Dams for which a downstream hazard potential has not been designated or is not provided.