Sweet Pond Dam

Sweet Pond
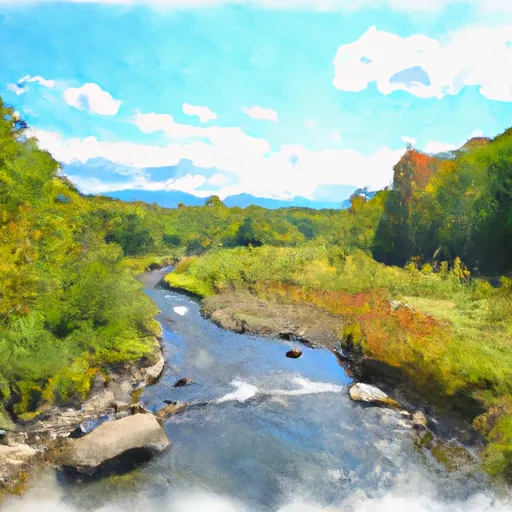
Sweet Pond, located in Guilford, Vermont, is a captivating water resource for climate enthusiasts and outdoor enthusiasts alike. This concrete dam, completed in 1928, stands at a height of 20 feet and has a storage capacity of 216 acre-feet. The pond covers an area of 18 acres and is fed by Keets Brook, adding to its natural beauty and ecological significance.
With a primary purpose of recreation, Sweet Pond offers visitors a serene escape into nature, with opportunities for fishing, boating, and wildlife observation. The dam's structural integrity is regularly inspected by the Vermont Department of Environmental Conservation, ensuring its safety for both the surrounding community and the environment. Despite its high hazard potential, the dam's condition is assessed as satisfactory, providing a sense of security for those who enjoy its recreational offerings.
As a state-regulated water resource, Sweet Pond is not only a source of enjoyment but also a crucial element in water management and conservation efforts in Windham County. Its historical significance, combined with its ecological importance, makes Sweet Pond a valuable asset for both residents and visitors who appreciate the intersection of water resources and climate stewardship.
Plan around the weather
Same NOAA / yr.no feed Snoflo's iOS app uses. Watch the precipitation column on the meteogram -- rain on the basin upstream typically lifts inflow 24-72 hours later.
Next 5 days, hour by hour
Temperature line with weather symbols on top, snow + rain accumulation as columns, humidity as a dotted line.
5-day forecast table
Every 3 hours, broken out across temperature, snow, rain, humidity, and wind. Each cell is colour-coded relative to the column min/max.
| Time | Condition | Temp (°F) | Snow (in) | Rain (in) | Humidity (%) | Wind (mps) | Wind dir |
|---|---|---|---|---|---|---|---|
| Loading detailed forecast… | |||||||
15-day temperature & precipitation
Daily temperatures, snow, and rain projected over the next two weeks.
Nearby streamflow gauges
USGS streamgauges around Sweet Pond -- inflows here typically show up in storage 24-72 hours later.
| Streamgauge | Discharge | View |
|---|---|---|
| Green River Near Colrain | 11 cfs | → |
| Ashuelot River At Hinsdale | 106 cfs | → |
| North River At Shattuckville | 24 cfs | → |
| Connecticut River At Montague City | 2,850 cfs | → |
| Deerfield River At Charlemont | 554 cfs | → |
| Millers River At Erving | 57 cfs | → |
Make a day of it
Boat launches, lakeside camping, fishing access, and other reservoirs near Sweet Pond.
Boat launches
See all →


Campgrounds
See all →


Fishing spots
See all →
River runs
See all →


About Sweet Pond
Where does the data for Sweet Pond come from?
Structural and regulatory data come from the U.S. Army Corps of Engineers' National Inventory of Dams (NID). Weather forecast comes from NOAA / yr.no -- the same feed Snoflo's iOS app uses.
How often is the report updated?
NID structural data refreshes annually as the Corps publishes updated assessments. The weather forecast refreshes throughout the day.
What does the High hazard rating mean?
The Corps of Engineers' hazard potential classification grades probable consequences if the dam fails: High = probable loss of human life; Significant = no probable loss of human life but possible economic loss / environmental damage; Low = no probable loss of human life, only minor economic / environmental losses. See the Dam Data Reference card below for the full definitions.
What's "% of normal"?
The current storage value compared to the historical average storage on this calendar day. 100% = right on average; values above 100% mean above-normal storage (wet year); values below mean below-normal (dry year or drought).
Can I get alerts when storage crosses a threshold?
Yes -- alerts are managed in the Snoflo iOS app. Favorite this dam, set a threshold, and you'll get a push the moment conditions cross.
Dam data reference
Condition Assessment
- Satisfactory
- No existing or potential dam safety deficiencies are recognized. Acceptable performance is expected under all loading conditions (static, hydrologic, seismic) in accordance with the minimum applicable state or federal regulatory criteria or tolerable risk guidelines.
- Fair
- No existing dam safety deficiencies are recognized for normal operating conditions. Rare or extreme hydrologic and/or seismic events may result in a dam safety deficiency. Risk may be in the range to take further action.
- Poor
- A dam safety deficiency is recognized for normal operating conditions which may realistically occur. Remedial action is necessary. POOR may also be used when uncertainties exist as to critical analysis parameters which identify a potential dam safety deficiency.
- Unsatisfactory
- A dam safety deficiency is recognized that requires immediate or emergency remedial action for problem resolution.
- Not Rated
- The dam has not been inspected, is not under state or federal jurisdiction, or has been inspected but, for whatever reason, has not been rated.
Hazard Potential Classification
- High
- Dams assigned the high hazard potential classification are those where failure or mis-operation will probably cause loss of human life.
- Significant
- Dams assigned the significant hazard potential classification are those dams where failure or mis-operation results in no probable loss of human life but can cause economic loss, environmental damage, disruption of lifeline facilities, or impact other concerns. Significant hazard potential classification dams are often located in predominantly rural or agricultural areas but could be in areas with population and significant infrastructure.
- Low
- Dams assigned the low hazard potential classification are those where failure or mis-operation results in no probable loss of human life and low economic and/or environmental losses. Losses are principally limited to the owner's property.
- Undetermined
- Dams for which a downstream hazard potential has not been designated or is not provided.