Jones Mill Dam

Jones Mill
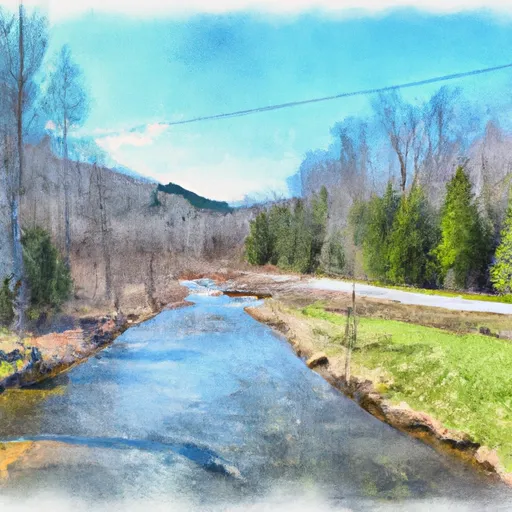
Jones Mill, located in Rutland, Vermont, along Jones Brook, is a historic dam with a primary purpose of recreation. Built in 1870, this concrete dam stands at a height of 12 feet and has a length of 50 feet, providing a storage capacity of 115 acre-feet. Despite its age, Jones Mill is still state-regulated by the Vermont Department of Environmental Conservation, with regular inspections and enforcement measures in place to ensure public safety.
The dam's condition is assessed as poor, with a significant hazard potential, indicating the need for ongoing maintenance and potential risk management measures. While the dam has not been modified in recent years, the last inspection in July 2016 highlighted the importance of emergency preparedness and the development of an Emergency Action Plan (EAP) to mitigate any potential risks associated with the dam. With its picturesque location and recreational opportunities, Jones Mill serves as a reminder of Vermont's rich history and the importance of responsible water resource management in the face of changing climate conditions.
As water resource and climate enthusiasts explore Jones Mill and its surrounding area, they can appreciate the blend of historical significance and natural beauty that this dam and its reservoir offer. With its stone core and gravity design, Jones Mill provides a glimpse into the past while also serving as a vital piece of infrastructure for the local community. As efforts continue to maintain and regulate this dam, it stands as a testament to the importance of balancing human needs with environmental stewardship in the face of evolving climate challenges.
Plan around the weather
Same NOAA / yr.no feed Snoflo's iOS app uses. Watch the precipitation column on the meteogram -- rain on the basin upstream typically lifts inflow 24-72 hours later.
Next 5 days, hour by hour
Temperature line with weather symbols on top, snow + rain accumulation as columns, humidity as a dotted line.
5-day forecast table
Every 3 hours, broken out across temperature, snow, rain, humidity, and wind. Each cell is colour-coded relative to the column min/max.
| Time | Condition | Temp (°F) | Snow (in) | Rain (in) | Humidity (%) | Wind (mps) | Wind dir |
|---|---|---|---|---|---|---|---|
| Loading detailed forecast… | |||||||
15-day temperature & precipitation
Daily temperatures, snow, and rain projected over the next two weeks.
Nearby streamflow gauges
USGS streamgauges around Jones Mill -- inflows here typically show up in storage 24-72 hours later.
| Streamgauge | Discharge | View |
|---|---|---|
| Otter Creek At Center Rutland | 153 cfs | → |
| Poultney River Below Fair Haven | 46 cfs | → |
| Otter Creek At Middlebury | 474 cfs | → |
| Ottauquechee River Near West Bridgewater | 12 cfs | → |
| New Haven River At Brooksville Nr Middlebury | 53 cfs | → |
| Putnam Creek East Of Crown Point Center Ny | 373 cfs | → |


About Jones Mill
Where does the data for Jones Mill come from?
Structural and regulatory data come from the U.S. Army Corps of Engineers' National Inventory of Dams (NID). Weather forecast comes from NOAA / yr.no -- the same feed Snoflo's iOS app uses.
How often is the report updated?
NID structural data refreshes annually as the Corps publishes updated assessments. The weather forecast refreshes throughout the day.
What does the Significant hazard rating mean?
The Corps of Engineers' hazard potential classification grades probable consequences if the dam fails: High = probable loss of human life; Significant = no probable loss of human life but possible economic loss / environmental damage; Low = no probable loss of human life, only minor economic / environmental losses. See the Dam Data Reference card below for the full definitions.
What's "% of normal"?
The current storage value compared to the historical average storage on this calendar day. 100% = right on average; values above 100% mean above-normal storage (wet year); values below mean below-normal (dry year or drought).
Can I get alerts when storage crosses a threshold?
Yes -- alerts are managed in the Snoflo iOS app. Favorite this dam, set a threshold, and you'll get a push the moment conditions cross.
Dam data reference
Condition Assessment
- Satisfactory
- No existing or potential dam safety deficiencies are recognized. Acceptable performance is expected under all loading conditions (static, hydrologic, seismic) in accordance with the minimum applicable state or federal regulatory criteria or tolerable risk guidelines.
- Fair
- No existing dam safety deficiencies are recognized for normal operating conditions. Rare or extreme hydrologic and/or seismic events may result in a dam safety deficiency. Risk may be in the range to take further action.
- Poor
- A dam safety deficiency is recognized for normal operating conditions which may realistically occur. Remedial action is necessary. POOR may also be used when uncertainties exist as to critical analysis parameters which identify a potential dam safety deficiency.
- Unsatisfactory
- A dam safety deficiency is recognized that requires immediate or emergency remedial action for problem resolution.
- Not Rated
- The dam has not been inspected, is not under state or federal jurisdiction, or has been inspected but, for whatever reason, has not been rated.
Hazard Potential Classification
- High
- Dams assigned the high hazard potential classification are those where failure or mis-operation will probably cause loss of human life.
- Significant
- Dams assigned the significant hazard potential classification are those dams where failure or mis-operation results in no probable loss of human life but can cause economic loss, environmental damage, disruption of lifeline facilities, or impact other concerns. Significant hazard potential classification dams are often located in predominantly rural or agricultural areas but could be in areas with population and significant infrastructure.
- Low
- Dams assigned the low hazard potential classification are those where failure or mis-operation results in no probable loss of human life and low economic and/or environmental losses. Losses are principally limited to the owner's property.
- Undetermined
- Dams for which a downstream hazard potential has not been designated or is not provided.