Herring Creek Millpond Dam

Herring Creek Millpond Dam
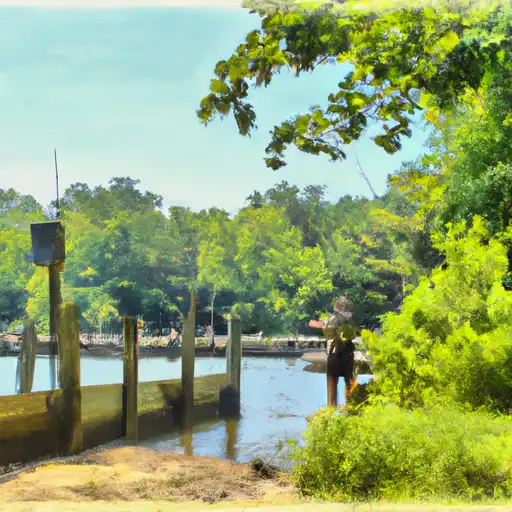
Herring Creek Millpond Dam, located in King William, Virginia, is a private-owned Earth dam that serves a primary purpose of recreation. With a height of 15 feet and a storage capacity of 144 acre-feet, the dam overlooks the scenic Herring Creek, providing opportunities for outdoor enthusiasts to engage in various water activities. Despite its undetermined hazard potential and not being rated for its condition assessment, the dam remains a popular destination for locals and visitors alike.
While the dam may not be regulated or inspected by state agencies, its presence contributes to the natural beauty of the surrounding area and offers a tranquil setting for relaxation and enjoyment. The dam's construction is a testament to human ingenuity and engineering prowess, as it harnesses the power of water for recreational purposes while blending seamlessly with the environment. Although its maintenance and safety protocols may not be as rigorously enforced as some state-regulated dams, the Herring Creek Millpond Dam stands as a testament to the intersection of water resources and climate management in a private context.
As water resource and climate enthusiasts explore the intricacies of the Herring Creek Millpond Dam, they are drawn to its unique design and purposeful existence within the landscape. While its risk assessment and management measures may be lacking in official documentation, the dam's role in providing a space for recreation and leisure cannot be underestimated. As visitors ponder the intersection of human intervention and natural ecosystems, the Herring Creek Millpond Dam stands as a reminder of the delicate balance between water resource utilization and environmental stewardship in the face of changing climates and growing demands for sustainable practices.
Plan around the weather
Same NOAA / yr.no feed Snoflo's iOS app uses. Watch the precipitation column on the meteogram -- rain on the basin upstream typically lifts inflow 24-72 hours later.
Next 5 days, hour by hour
Temperature line with weather symbols on top, snow + rain accumulation as columns, humidity as a dotted line.
5-day forecast table
Every 3 hours, broken out across temperature, snow, rain, humidity, and wind. Each cell is colour-coded relative to the column min/max.
| Time | Condition | Temp (°F) | Snow (in) | Rain (in) | Humidity (%) | Wind (mps) | Wind dir |
|---|---|---|---|---|---|---|---|
| Loading detailed forecast… | |||||||
15-day temperature & precipitation
Daily temperatures, snow, and rain projected over the next two weeks.
Nearby streamflow gauges
USGS streamgauges around Herring Creek Millpond Dam -- inflows here typically show up in storage 24-72 hours later.
| Streamgauge | Discharge | View |
|---|---|---|
| Mattaponi River Near Beulahville | 185 cfs | → |
| Pamunkey River Near Hanover | 237 cfs | → |
| Totopotomoy Creek Near Studley | 20 cfs | → |
| Piscataway Creek Near Tappahannock | 8 cfs | → |
| North Anna River At Hart Corner Near Doswell | 51 cfs | → |
| Little River Near Doswell | 15 cfs | → |
Make a day of it
Boat launches, lakeside camping, fishing access, and other reservoirs near Herring Creek Millpond Dam.
Boat launches
See all →


About Herring Creek Millpond Dam
Where does the data for Herring Creek Millpond Dam come from?
Structural and regulatory data come from the U.S. Army Corps of Engineers' National Inventory of Dams (NID). Weather forecast comes from NOAA / yr.no -- the same feed Snoflo's iOS app uses.
How often is the report updated?
NID structural data refreshes annually as the Corps publishes updated assessments. The weather forecast refreshes throughout the day.
What does the Undetermined hazard rating mean?
The Corps of Engineers' hazard potential classification grades probable consequences if the dam fails: High = probable loss of human life; Significant = no probable loss of human life but possible economic loss / environmental damage; Low = no probable loss of human life, only minor economic / environmental losses. See the Dam Data Reference card below for the full definitions.
What's "% of normal"?
The current storage value compared to the historical average storage on this calendar day. 100% = right on average; values above 100% mean above-normal storage (wet year); values below mean below-normal (dry year or drought).
Can I get alerts when storage crosses a threshold?
Yes -- alerts are managed in the Snoflo iOS app. Favorite this dam, set a threshold, and you'll get a push the moment conditions cross.
Dam data reference
Condition Assessment
- Satisfactory
- No existing or potential dam safety deficiencies are recognized. Acceptable performance is expected under all loading conditions (static, hydrologic, seismic) in accordance with the minimum applicable state or federal regulatory criteria or tolerable risk guidelines.
- Fair
- No existing dam safety deficiencies are recognized for normal operating conditions. Rare or extreme hydrologic and/or seismic events may result in a dam safety deficiency. Risk may be in the range to take further action.
- Poor
- A dam safety deficiency is recognized for normal operating conditions which may realistically occur. Remedial action is necessary. POOR may also be used when uncertainties exist as to critical analysis parameters which identify a potential dam safety deficiency.
- Unsatisfactory
- A dam safety deficiency is recognized that requires immediate or emergency remedial action for problem resolution.
- Not Rated
- The dam has not been inspected, is not under state or federal jurisdiction, or has been inspected but, for whatever reason, has not been rated.
Hazard Potential Classification
- High
- Dams assigned the high hazard potential classification are those where failure or mis-operation will probably cause loss of human life.
- Significant
- Dams assigned the significant hazard potential classification are those dams where failure or mis-operation results in no probable loss of human life but can cause economic loss, environmental damage, disruption of lifeline facilities, or impact other concerns. Significant hazard potential classification dams are often located in predominantly rural or agricultural areas but could be in areas with population and significant infrastructure.
- Low
- Dams assigned the low hazard potential classification are those where failure or mis-operation results in no probable loss of human life and low economic and/or environmental losses. Losses are principally limited to the owner's property.
- Undetermined
- Dams for which a downstream hazard potential has not been designated or is not provided.