Summary
Total streamflow across the
Nolichucky River
was last observed at
1,360
cfs, and is expected to yield approximately
2,698
acre-ft of water today; about 15%
of normal.
River levels are low and may signify a drought.
Average streamflow for this time of year is
9,345 cfs,
with recent peaks last observed
on
2025-07-07 when daily discharge volume was observed at
120,000 cfs.
Maximum discharge along the river is currently at the
Nolichucky River At Embreeville
reporting a streamflow rate of 2,020 cfs.
However, the streamgauge with the highest stage along the river is the
Nolichucky River Below Nolichucky Dam
with a gauge stage of 42.34 ft.
This river is monitored from 3 different streamgauging stations along the Nolichucky River, the highest being situated at an altitude of 1,533 ft, the
Nolichucky River At Embreeville.
15-Day Weather Outlook
River Details
| Last Updated | 2026-02-12 |
| Discharge Volume | 2,698 ACRE-FT |
| Streamflow |
1,360.0 cfs
-1050.0 cfs (-43.57%) |
| Percent of Normal | 14.55% |
| Maximum |
120,000.0 cfs
2025-07-07 |
| Seasonal Avg | 9,345 cfs |
River Streamflow Levels
| Streamgauge | Streamflow | Gauge Stage | 24hr Change (%) | % Normal | Minimum (cfs) | Maximum (cfs) | Air Temp | Elevation |
|---|---|---|---|---|---|---|---|---|
|
Nolichucky River At Embreeville
USGS 03465500 |
2020 cfs | 2.69 ft | -6.05 | |||||
|
Nolichucky River Below Nolichucky Dam
USGS 03466500 |
1360 cfs | 42.34 ft | 29.52 | |||||
|
Nolichucky River Near Lowland
USGS 03467609 |
1310 cfs | 7.7 ft | -3.68 |
Seasonal Discharge Comparison
Maximum Streamflow Discharge
Streamflow Elevation Profile
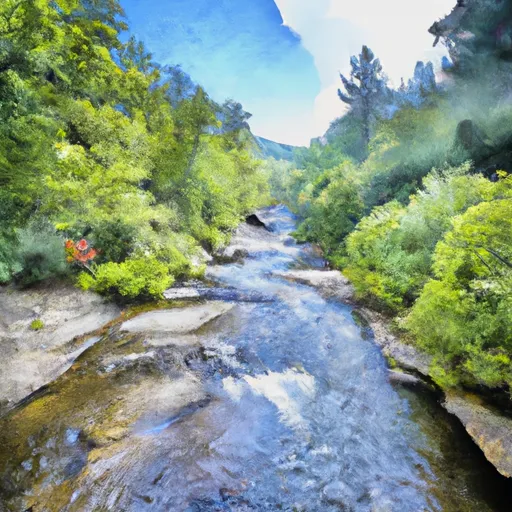
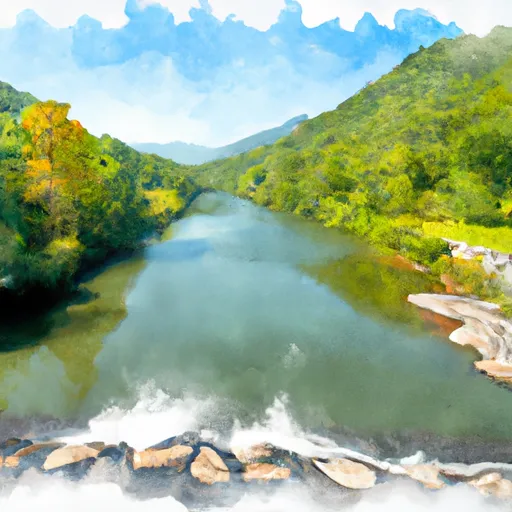
The Nolichucky River is a 115-mile (185 km) river that flows through Western North Carolina and East Tennessee, in the southeastern United States. Traversing the Pisgah National Forest and the Cherokee National Forest in the Blue Ridge Mountains, the river's watershed is home to some of the highest mountains in the Appalachians, including Mount Mitchell, the highest point in the eastern United States. The river is a tributary of the French Broad River, and is impounded by Nolichucky Dam near Greeneville, Tennessee.

 Headwaters Above Linville Gap To Blue Ridge Parkway Boundary
 Watauga Reservoir To Tn/Nc State Line
 Blue Ridge Parkway Boundary To Linville Gorge Boundary