Eason Lake Dam Dam

Eason Lake Dam
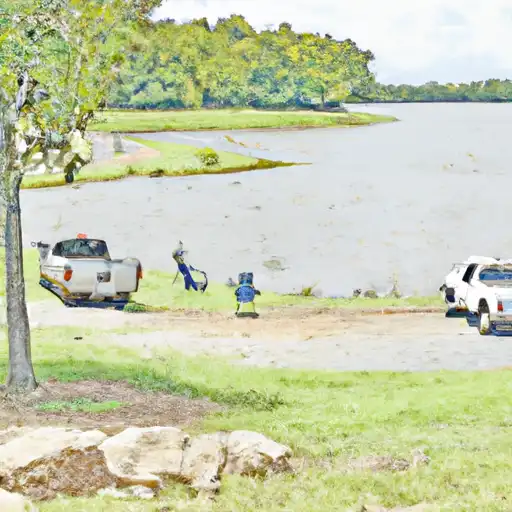
Eason Lake Dam, located in St. Charles, Arkansas, was completed in 1961 and serves primarily for recreational purposes. This private earth dam stands at a height of 22 feet with a hydraulic height of 19 feet and a structural height of 22 feet. The dam has a length of 310 feet and a storage capacity of 69 acre-feet, with a normal storage capacity of 57 acre-feet. The dam is situated on the Sandy Bayou-Os river/stream in Arkansas county.
With a hazard potential rated as low and a condition assessment of "Not Rated," Eason Lake Dam has not been inspected recently. The dam has not been modified over the years and does not have an Emergency Action Plan (EAP) in place. Despite being privately owned, the dam does not fall under state regulation or inspection. The dam's maximum discharge is 468 cubic feet per second, and it covers a surface area of 5.7 acres with a drainage area of 0.1 acres.
Enthusiasts with an interest in water resources and climate will find Eason Lake Dam intriguing due to its historical significance in providing recreational opportunities in the area. The dam's unique design and location on the Sandy Bayou-Os river/stream make it a notable landmark in Arkansas county. While the dam's low hazard potential suggests a lower risk factor, the lack of recent inspections and emergency preparedness measures may raise concerns among those monitoring the safety and maintenance of water infrastructure in the region. Overall, Eason Lake Dam presents an interesting case study for water resource enthusiasts interested in the intersection of recreation, infrastructure, and environmental management.
Plan around the weather
Same NOAA / yr.no feed Snoflo's iOS app uses. Watch the precipitation column on the meteogram -- rain on the basin upstream typically lifts inflow 24-72 hours later.
Next 5 days, hour by hour
Temperature line with weather symbols on top, snow + rain accumulation as columns, humidity as a dotted line.
5-day forecast table
Every 3 hours, broken out across temperature, snow, rain, humidity, and wind. Each cell is colour-coded relative to the column min/max.
| Time | Condition | Temp (°F) | Snow (in) | Rain (in) | Humidity (%) | Wind (mps) | Wind dir |
|---|---|---|---|---|---|---|---|
| Loading detailed forecast… | |||||||
15-day temperature & precipitation
Daily temperatures, snow, and rain projected over the next two weeks.
Nearby streamflow gauges
USGS streamgauges around Eason Lake Dam -- inflows here typically show up in storage 24-72 hours later.
| Streamgauge | Discharge | View |
|---|---|---|
| White River At Devalls Bluff | 20,500 cfs | → |
| Big Sunflower River At Clarksdale | 8 cfs | → |
| Languille River At Palestine | 948 cfs | → |
| Cache River Near Cotton Plant | 901 cfs | → |
| Bayou Meto Near Lonoke | 24 cfs | → |
| Bayou Bartholomew At Garrett Bridge | 54 cfs | → |


About Eason Lake Dam
Where does the data for Eason Lake Dam come from?
Structural and regulatory data come from the U.S. Army Corps of Engineers' National Inventory of Dams (NID). Weather forecast comes from NOAA / yr.no -- the same feed Snoflo's iOS app uses.
How often is the report updated?
NID structural data refreshes annually as the Corps publishes updated assessments. The weather forecast refreshes throughout the day.
What does the Low hazard rating mean?
The Corps of Engineers' hazard potential classification grades probable consequences if the dam fails: High = probable loss of human life; Significant = no probable loss of human life but possible economic loss / environmental damage; Low = no probable loss of human life, only minor economic / environmental losses. See the Dam Data Reference card below for the full definitions.
What's "% of normal"?
The current storage value compared to the historical average storage on this calendar day. 100% = right on average; values above 100% mean above-normal storage (wet year); values below mean below-normal (dry year or drought).
Can I get alerts when storage crosses a threshold?
Yes -- alerts are managed in the Snoflo iOS app. Favorite this dam, set a threshold, and you'll get a push the moment conditions cross.
Dam data reference
Condition Assessment
- Satisfactory
- No existing or potential dam safety deficiencies are recognized. Acceptable performance is expected under all loading conditions (static, hydrologic, seismic) in accordance with the minimum applicable state or federal regulatory criteria or tolerable risk guidelines.
- Fair
- No existing dam safety deficiencies are recognized for normal operating conditions. Rare or extreme hydrologic and/or seismic events may result in a dam safety deficiency. Risk may be in the range to take further action.
- Poor
- A dam safety deficiency is recognized for normal operating conditions which may realistically occur. Remedial action is necessary. POOR may also be used when uncertainties exist as to critical analysis parameters which identify a potential dam safety deficiency.
- Unsatisfactory
- A dam safety deficiency is recognized that requires immediate or emergency remedial action for problem resolution.
- Not Rated
- The dam has not been inspected, is not under state or federal jurisdiction, or has been inspected but, for whatever reason, has not been rated.
Hazard Potential Classification
- High
- Dams assigned the high hazard potential classification are those where failure or mis-operation will probably cause loss of human life.
- Significant
- Dams assigned the significant hazard potential classification are those dams where failure or mis-operation results in no probable loss of human life but can cause economic loss, environmental damage, disruption of lifeline facilities, or impact other concerns. Significant hazard potential classification dams are often located in predominantly rural or agricultural areas but could be in areas with population and significant infrastructure.
- Low
- Dams assigned the low hazard potential classification are those where failure or mis-operation results in no probable loss of human life and low economic and/or environmental losses. Losses are principally limited to the owner's property.
- Undetermined
- Dams for which a downstream hazard potential has not been designated or is not provided.