Lake Combie Dam

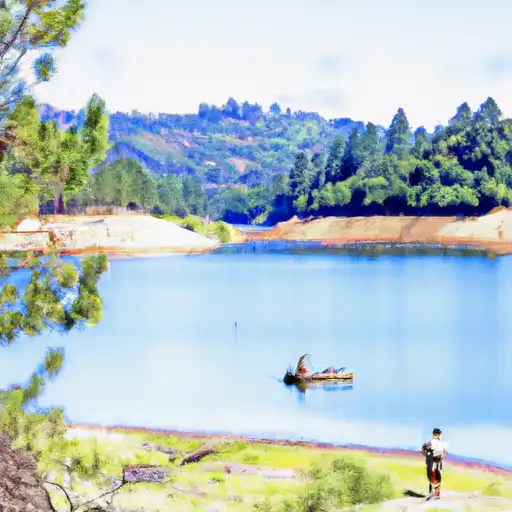
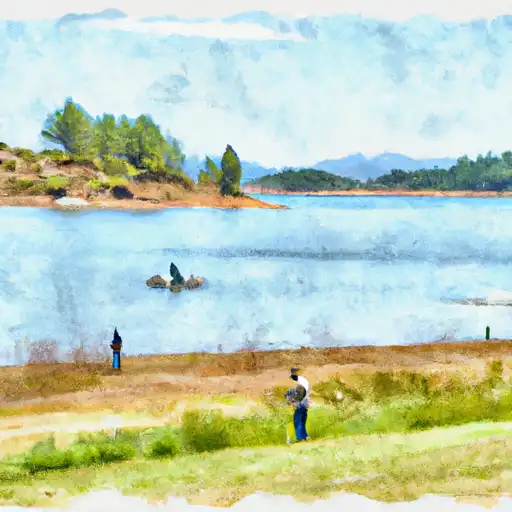
Lake Combie
Lake Combie, located in Magnolia, California, is a captivating water resource with a rich history dating back to its completion in 1928. This concrete dam stands at an impressive 95 feet tall, with a hydraulic height of 90 feet and a structural height reaching 100 feet. The reservoir boasts a storage capacity of 5,555 acre-feet, serving primarily for irrigation purposes while also supporting hydroelectric power generation and water supply.
Managed by the Federal Energy Regulatory Commission, Lake Combie is subject to rigorous state regulation, inspection, and enforcement to ensure its safety and efficiency. The dam spans 762 feet in length, covering a surface area of 360 acres and draining a 135.6-square-mile watershed area. With a maximum discharge capacity of 28,700 cubic feet per second and a spillway of uncontrolled type, this reservoir poses a high hazard potential while maintaining a moderate risk assessment rating.
As a key water resource in Nevada County, Lake Combie provides essential services to the local community and beyond. Its picturesque setting along the Bear River, with the involvement of notable designers like Fred Tibbits and State Engineer, adds to the allure of this hydrological gem. With its strategic location and significant storage capacity, Lake Combie remains a vital asset for irrigation, hydroelectric power, and water supply in the region, making it a must-visit destination for water resource and climate enthusiasts seeking to appreciate the intersection of engineering marvels and natural beauty.
Plan around the weather
Same NOAA / yr.no feed Snoflo's iOS app uses. Watch the precipitation column on the meteogram -- rain on the basin upstream typically lifts inflow 24-72 hours later.
Next 5 days, hour by hour
Temperature line with weather symbols on top, snow + rain accumulation as columns, humidity as a dotted line.
5-day forecast table
Every 3 hours, broken out across temperature, snow, rain, humidity, and wind. Each cell is colour-coded relative to the column min/max.
| Time | Condition | Temp (°F) | Snow (in) | Rain (in) | Humidity (%) | Wind (mps) | Wind dir |
|---|---|---|---|---|---|---|---|
| Loading detailed forecast… | |||||||
15-day temperature & precipitation
Daily temperatures, snow, and rain projected over the next two weeks.
Nearby streamflow gauges
USGS streamgauges around Lake Combie -- inflows here typically show up in storage 24-72 hours later.
| Streamgauge | Discharge | View |
|---|---|---|
| Nf American R A North Fork Dam Ca | 84 cfs | → |
| Deer C Nr Smartville Ca | 3 cfs | → |
| Bear R Nr Wheatland Ca | 25 cfs | → |
| Dry C A Vernon St Bridge A Roseville Ca | 159 cfs | → |
| Pilot C Bl Mutton Canyon Nr Georgetown Ca | 2 cfs | → |
| Deer C Nr Cameron Park Ca | 8 cfs | → |


About Lake Combie
Where does the data for Lake Combie come from?
Structural and regulatory data come from the U.S. Army Corps of Engineers' National Inventory of Dams (NID). Weather forecast comes from NOAA / yr.no -- the same feed Snoflo's iOS app uses.
How often is the report updated?
NID structural data refreshes annually as the Corps publishes updated assessments. The weather forecast refreshes throughout the day.
What does the High hazard rating mean?
The Corps of Engineers' hazard potential classification grades probable consequences if the dam fails: High = probable loss of human life; Significant = no probable loss of human life but possible economic loss / environmental damage; Low = no probable loss of human life, only minor economic / environmental losses. See the Dam Data Reference card below for the full definitions.
What's "% of normal"?
The current storage value compared to the historical average storage on this calendar day. 100% = right on average; values above 100% mean above-normal storage (wet year); values below mean below-normal (dry year or drought).
Can I get alerts when storage crosses a threshold?
Yes -- alerts are managed in the Snoflo iOS app. Favorite this dam, set a threshold, and you'll get a push the moment conditions cross.
Dam data reference
Condition Assessment
- Satisfactory
- No existing or potential dam safety deficiencies are recognized. Acceptable performance is expected under all loading conditions (static, hydrologic, seismic) in accordance with the minimum applicable state or federal regulatory criteria or tolerable risk guidelines.
- Fair
- No existing dam safety deficiencies are recognized for normal operating conditions. Rare or extreme hydrologic and/or seismic events may result in a dam safety deficiency. Risk may be in the range to take further action.
- Poor
- A dam safety deficiency is recognized for normal operating conditions which may realistically occur. Remedial action is necessary. POOR may also be used when uncertainties exist as to critical analysis parameters which identify a potential dam safety deficiency.
- Unsatisfactory
- A dam safety deficiency is recognized that requires immediate or emergency remedial action for problem resolution.
- Not Rated
- The dam has not been inspected, is not under state or federal jurisdiction, or has been inspected but, for whatever reason, has not been rated.
Hazard Potential Classification
- High
- Dams assigned the high hazard potential classification are those where failure or mis-operation will probably cause loss of human life.
- Significant
- Dams assigned the significant hazard potential classification are those dams where failure or mis-operation results in no probable loss of human life but can cause economic loss, environmental damage, disruption of lifeline facilities, or impact other concerns. Significant hazard potential classification dams are often located in predominantly rural or agricultural areas but could be in areas with population and significant infrastructure.
- Low
- Dams assigned the low hazard potential classification are those where failure or mis-operation results in no probable loss of human life and low economic and/or environmental losses. Losses are principally limited to the owner's property.
- Undetermined
- Dams for which a downstream hazard potential has not been designated or is not provided.