Lundy Lake Dam

Lundy Lake
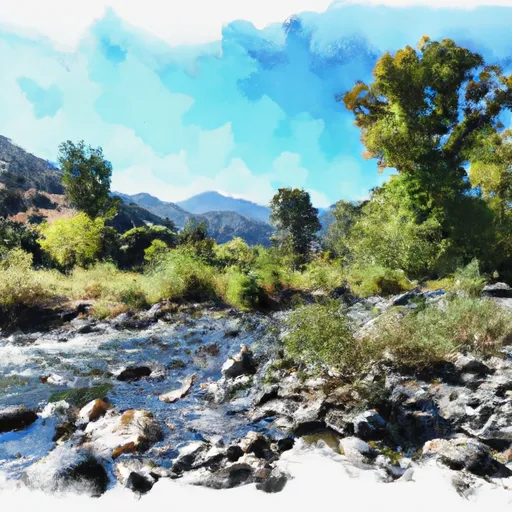
Lundy Lake, also known as Mill Creek, is a privately owned water resource located in Mono County, California. The dam was completed in 1911 and has a height of 48 feet, serving primarily for hydroelectric purposes. With a storage capacity of 4,113 acre-feet and a surface area of 132 acres, Lundy Lake provides not only essential water resources but also recreational opportunities for visitors.
Managed by the Federal Energy Regulatory Commission, Lundy Lake's dam is classified as a rockfill structure and has a spillway width of 150 feet. Despite being categorized as having a high hazard potential, the risk assessment for the dam is moderate. Regular inspections are conducted to ensure the safety and integrity of the structure, with the last inspection taking place in September 2020. The dam's location in the picturesque Lee Vining area adds to its allure for water resource and climate enthusiasts seeking to explore its historical significance and natural beauty.
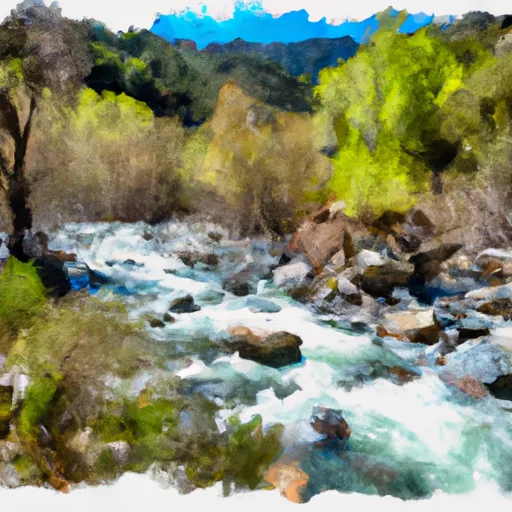
Overall, Lundy Lake stands as a testament to the harmonious blend of human infrastructure and natural landscapes, highlighting the importance of sustainable water resource management in the face of climate change challenges. As a vital component of California's water infrastructure, the dam at Lundy Lake serves as a reminder of the delicate balance between harnessing water resources for energy production while preserving the environment for future generations to enjoy. For those passionate about water resources and climate advocacy, Lundy Lake offers a captivating case study of innovation, regulation, and conservation in action.
Plan around the weather
Same NOAA / yr.no feed Snoflo's iOS app uses. Watch the precipitation column on the meteogram -- rain on the basin upstream typically lifts inflow 24-72 hours later.
Next 5 days, hour by hour
Temperature line with weather symbols on top, snow + rain accumulation as columns, humidity as a dotted line.
5-day forecast table
Every 3 hours, broken out across temperature, snow, rain, humidity, and wind. Each cell is colour-coded relative to the column min/max.
| Time | Condition | Temp (°F) | Snow (in) | Rain (in) | Humidity (%) | Wind (mps) | Wind dir |
|---|---|---|---|---|---|---|---|
| Loading detailed forecast… | |||||||
15-day temperature & precipitation
Daily temperatures, snow, and rain projected over the next two weeks.
Nearby streamflow gauges
USGS streamgauges around Lundy Lake -- inflows here typically show up in storage 24-72 hours later.
| Streamgauge | Discharge | View |
|---|---|---|
| Green Creek Near Bridgeport | 13 cfs | → |
| Robinson C At Twin Lks Outlet Nr Bridgeport | 98 cfs | → |
| Buckeye C Nr Bridgeport | 20 cfs | → |
| E Walker R Nr Bridgeport | 181 cfs | → |
| Deadman C A Big Springs Nr Crestview Ca | 20 cfs | → |
| Tuolumne R A Grand Cyn Of Tuolumne Ab Hetch Hetchy | 49 cfs | → |


About Lundy Lake
Where does the data for Lundy Lake come from?
Structural and regulatory data come from the U.S. Army Corps of Engineers' National Inventory of Dams (NID). Weather forecast comes from NOAA / yr.no -- the same feed Snoflo's iOS app uses.
How often is the report updated?
NID structural data refreshes annually as the Corps publishes updated assessments. The weather forecast refreshes throughout the day.
What does the High hazard rating mean?
The Corps of Engineers' hazard potential classification grades probable consequences if the dam fails: High = probable loss of human life; Significant = no probable loss of human life but possible economic loss / environmental damage; Low = no probable loss of human life, only minor economic / environmental losses. See the Dam Data Reference card below for the full definitions.
What's "% of normal"?
The current storage value compared to the historical average storage on this calendar day. 100% = right on average; values above 100% mean above-normal storage (wet year); values below mean below-normal (dry year or drought).
Can I get alerts when storage crosses a threshold?
Yes -- alerts are managed in the Snoflo iOS app. Favorite this dam, set a threshold, and you'll get a push the moment conditions cross.
Dam data reference
Condition Assessment
- Satisfactory
- No existing or potential dam safety deficiencies are recognized. Acceptable performance is expected under all loading conditions (static, hydrologic, seismic) in accordance with the minimum applicable state or federal regulatory criteria or tolerable risk guidelines.
- Fair
- No existing dam safety deficiencies are recognized for normal operating conditions. Rare or extreme hydrologic and/or seismic events may result in a dam safety deficiency. Risk may be in the range to take further action.
- Poor
- A dam safety deficiency is recognized for normal operating conditions which may realistically occur. Remedial action is necessary. POOR may also be used when uncertainties exist as to critical analysis parameters which identify a potential dam safety deficiency.
- Unsatisfactory
- A dam safety deficiency is recognized that requires immediate or emergency remedial action for problem resolution.
- Not Rated
- The dam has not been inspected, is not under state or federal jurisdiction, or has been inspected but, for whatever reason, has not been rated.
Hazard Potential Classification
- High
- Dams assigned the high hazard potential classification are those where failure or mis-operation will probably cause loss of human life.
- Significant
- Dams assigned the significant hazard potential classification are those dams where failure or mis-operation results in no probable loss of human life but can cause economic loss, environmental damage, disruption of lifeline facilities, or impact other concerns. Significant hazard potential classification dams are often located in predominantly rural or agricultural areas but could be in areas with population and significant infrastructure.
- Low
- Dams assigned the low hazard potential classification are those where failure or mis-operation results in no probable loss of human life and low economic and/or environmental losses. Losses are principally limited to the owner's property.
- Undetermined
- Dams for which a downstream hazard potential has not been designated or is not provided.