Lagoon Valley County Park Dam

Lagoon Valley County Park
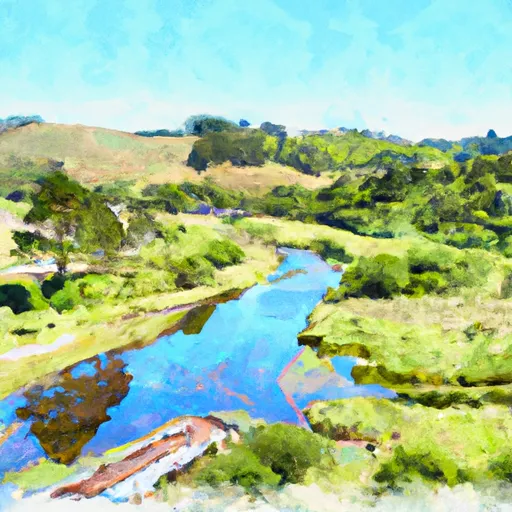
Lagoon Valley County Park, located in Vacaville, California, is a stunning park that serves as both a recreational destination and a vital water supply source. This park is home to the Lagoon Creek, which feeds into the Tr Laguna Creek, making it an essential part of the local water system. The park's primary purpose is water supply, with a dam that was completed in 1981 standing at a height of 13 feet and providing a storage capacity of 780 acre-feet.
The dam at Lagoon Valley County Park is classified as an Earth dam, and its low hazard potential and satisfactory condition assessment make it a safe and reliable structure. With a surface area of 105 acres and a drainage area of 2.5 square miles, the park offers not only water-related activities but also ample space for outdoor recreation. The park's proximity to the city of Vacaville makes it a popular destination for both locals and visitors looking to enjoy nature and appreciate the importance of water resource management in a changing climate.
Managed by the local government, Lagoon Valley County Park is a well-maintained and regulated site, with state jurisdiction and oversight ensuring the safety and sustainability of its water supply infrastructure. Whether you're interested in exploring the area's natural beauty, learning about water conservation, or simply enjoying a day outdoors, Lagoon Valley County Park offers a unique blend of environmental education and recreational opportunities for water resource and climate enthusiasts alike.
Plan around the weather
Same NOAA / yr.no feed Snoflo's iOS app uses. Watch the precipitation column on the meteogram -- rain on the basin upstream typically lifts inflow 24-72 hours later.
Next 5 days, hour by hour
Temperature line with weather symbols on top, snow + rain accumulation as columns, humidity as a dotted line.
5-day forecast table
Every 3 hours, broken out across temperature, snow, rain, humidity, and wind. Each cell is colour-coded relative to the column min/max.
| Time | Condition | Temp (°F) | Snow (in) | Rain (in) | Humidity (%) | Wind (mps) | Wind dir |
|---|---|---|---|---|---|---|---|
| Loading detailed forecast… | |||||||
15-day temperature & precipitation
Daily temperatures, snow, and rain projected over the next two weeks.
Nearby streamflow gauges
USGS streamgauges around Lagoon Valley County Park -- inflows here typically show up in storage 24-72 hours later.
| Streamgauge | Discharge | View |
|---|---|---|
| Putah C Nr Winters Ca | 599 cfs | → |
| Napa R Nr Napa Ca | 7 cfs | → |
| Shag Slough A Liberty Island Nr Courtland Ca | 3,500 cfs | → |
| Cache Slough A S Liberty Island Nr Rio Vista Ca | 4,280 cfs | → |
| Sacramento R Deep Water Ship Channel Nr Rio Vista | 9,620 cfs | → |
| Toe Drain A Liberty Island Nr Courtland Ca | 602 cfs | → |
Make a day of it
Boat launches, lakeside camping, fishing access, and other reservoirs near Lagoon Valley County Park.
Boat launches
See all →


Campgrounds
See all →


Fishing spots
See all →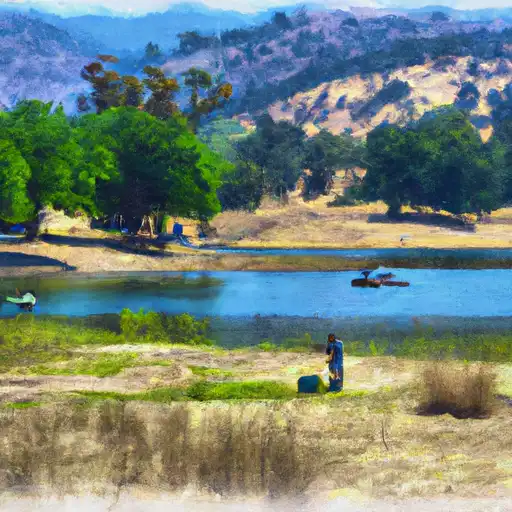


River runs
See all →


About Lagoon Valley County Park
Where does the data for Lagoon Valley County Park come from?
Structural and regulatory data come from the U.S. Army Corps of Engineers' National Inventory of Dams (NID). Weather forecast comes from NOAA / yr.no -- the same feed Snoflo's iOS app uses.
How often is the report updated?
NID structural data refreshes annually as the Corps publishes updated assessments. The weather forecast refreshes throughout the day.
What does the Low hazard rating mean?
The Corps of Engineers' hazard potential classification grades probable consequences if the dam fails: High = probable loss of human life; Significant = no probable loss of human life but possible economic loss / environmental damage; Low = no probable loss of human life, only minor economic / environmental losses. See the Dam Data Reference card below for the full definitions.
What's "% of normal"?
The current storage value compared to the historical average storage on this calendar day. 100% = right on average; values above 100% mean above-normal storage (wet year); values below mean below-normal (dry year or drought).
Can I get alerts when storage crosses a threshold?
Yes -- alerts are managed in the Snoflo iOS app. Favorite this dam, set a threshold, and you'll get a push the moment conditions cross.
Dam data reference
Condition Assessment
- Satisfactory
- No existing or potential dam safety deficiencies are recognized. Acceptable performance is expected under all loading conditions (static, hydrologic, seismic) in accordance with the minimum applicable state or federal regulatory criteria or tolerable risk guidelines.
- Fair
- No existing dam safety deficiencies are recognized for normal operating conditions. Rare or extreme hydrologic and/or seismic events may result in a dam safety deficiency. Risk may be in the range to take further action.
- Poor
- A dam safety deficiency is recognized for normal operating conditions which may realistically occur. Remedial action is necessary. POOR may also be used when uncertainties exist as to critical analysis parameters which identify a potential dam safety deficiency.
- Unsatisfactory
- A dam safety deficiency is recognized that requires immediate or emergency remedial action for problem resolution.
- Not Rated
- The dam has not been inspected, is not under state or federal jurisdiction, or has been inspected but, for whatever reason, has not been rated.
Hazard Potential Classification
- High
- Dams assigned the high hazard potential classification are those where failure or mis-operation will probably cause loss of human life.
- Significant
- Dams assigned the significant hazard potential classification are those dams where failure or mis-operation results in no probable loss of human life but can cause economic loss, environmental damage, disruption of lifeline facilities, or impact other concerns. Significant hazard potential classification dams are often located in predominantly rural or agricultural areas but could be in areas with population and significant infrastructure.
- Low
- Dams assigned the low hazard potential classification are those where failure or mis-operation results in no probable loss of human life and low economic and/or environmental losses. Losses are principally limited to the owner's property.
- Undetermined
- Dams for which a downstream hazard potential has not been designated or is not provided.