Diamond Valley Reservoir
As of July 20, 2026, Diamond Valley is holding 744,663 acre-ft of water — 118% of normal storage for this date. Storage data refreshed throughout the day.

Diamond Valley
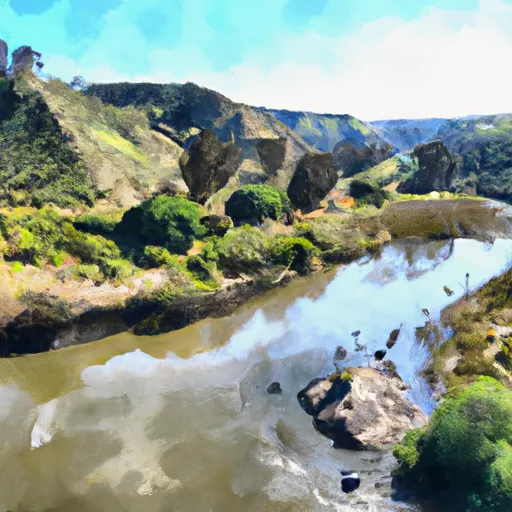
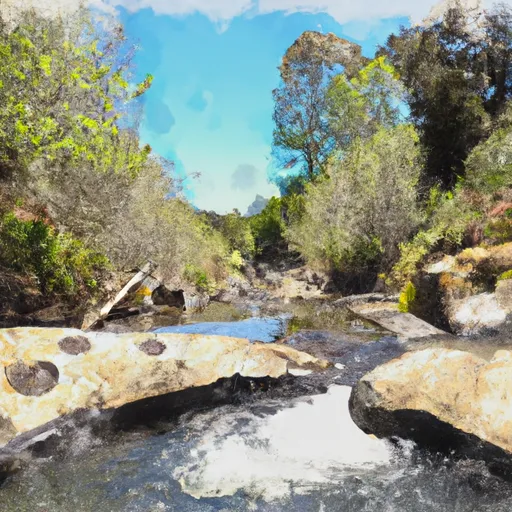
Diamond Valley Lake in California was created in 1999, and is the largest reservoir in Southern California. The lake is primarily used for municipal drinking water, but it also provides recreational opportunities, such as fishing and boating. The hydrology of the lake is largely dependent on surface flow and snowpack from the San Jacinto Mountains. The lake is managed by the Metropolitan Water District of Southern California, who also operate the Robert B. Diemer Water Treatment Plant. Surrounding the lake is the Diamond Valley Lake Marina, a recreational area that offers fishing, boating, and hiking. In addition, a portion of the surrounding land is used for agricultural purposes, with crops such as grapes and citrus being grown in the area. Overall, Diamond Valley Lake plays a significant role in providing water and recreational opportunities for Southern California.
Daily levels at Diamond Valley
Storage volume, pool elevation, and total release plotted from the operating agency's daily observations.
Storage
acre-ft · code 2
Pool Elevation
ft · code 1
Plan around the weather
Same NOAA / yr.no feed Snoflo's iOS app uses. Watch the precipitation column on the meteogram -- rain on the basin upstream typically lifts inflow 24-72 hours later.
Next 5 days, hour by hour
Temperature line with weather symbols on top, snow + rain accumulation as columns, humidity as a dotted line.
5-day forecast table
Every 3 hours, broken out across temperature, snow, rain, humidity, and wind. Each cell is colour-coded relative to the column min/max.
| Time | Condition | Temp (°F) | Snow (in) | Rain (in) | Humidity (%) | Wind (mps) | Wind dir |
|---|---|---|---|---|---|---|---|
| Loading detailed forecast… | |||||||
15-day temperature & precipitation
Daily temperatures, snow, and rain projected over the next two weeks.
Nearby streamflow gauges
USGS streamgauges around Diamond Valley -- inflows here typically show up in storage 24-72 hours later.


About Diamond Valley
Where does the data for Diamond Valley come from?
Daily storage, pool elevation, and release rates are sourced from USGS, USBR, and USACE monitoring stations. Weather forecast comes from NOAA / yr.no -- the same feed Snoflo's iOS app uses.
How often is the report updated?
Storage observations are updated daily by the operating agency. The 15-day weather forecast refreshes throughout the day. Snoflo caches and renders the most recent observation -- check the "as of" timestamp on the storage card.
What does the Hazard hazard rating mean?
The Corps of Engineers' hazard potential classification grades probable consequences if the dam fails: High = probable loss of human life; Significant = no probable loss of human life but possible economic loss / environmental damage; Low = no probable loss of human life, only minor economic / environmental losses. See the Dam Data Reference card below for the full definitions.
What's "% of normal"?
The current storage value compared to the historical average storage on this calendar day. 100% = right on average; values above 100% mean above-normal storage (wet year); values below mean below-normal (dry year or drought).
Can I get alerts when storage crosses a threshold?
Yes -- alerts are managed in the Snoflo iOS app. Favorite this reservoir, set a threshold, and you'll get a push the moment conditions cross.